Yup'ik vs Trinidadian and Tobagonian Unemployment
COMPARE
Yup'ik
Trinidadian and Tobagonian
Unemployment
Unemployment Comparison
Yup'ik
Trinidadians and Tobagonians
13.6%
UNEMPLOYMENT
0.0/ 100
METRIC RATING
347th/ 347
METRIC RANK
6.3%
UNEMPLOYMENT
0.0/ 100
METRIC RATING
301st/ 347
METRIC RANK
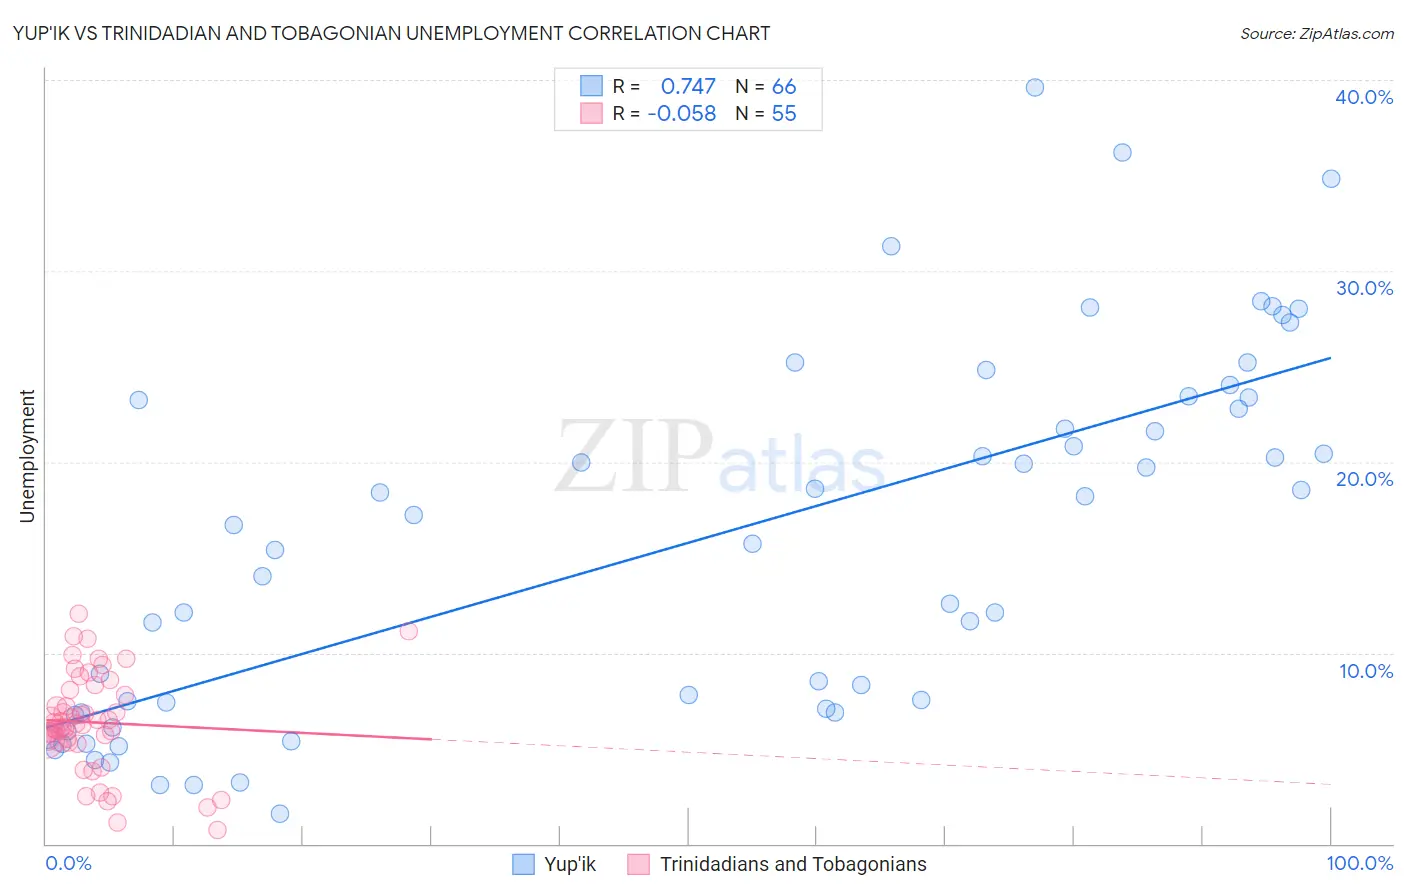
Yup'ik vs Trinidadian and Tobagonian Unemployment Correlation Chart
The statistical analysis conducted on geographies consisting of 39,958,223 people shows a strong positive correlation between the proportion of Yup'ik and unemployment in the United States with a correlation coefficient (R) of 0.747 and weighted average of 13.6%. Similarly, the statistical analysis conducted on geographies consisting of 219,752,630 people shows a slight negative correlation between the proportion of Trinidadians and Tobagonians and unemployment in the United States with a correlation coefficient (R) of -0.058 and weighted average of 6.3%, a difference of 114.9%.
Unemployment Correlation Summary
| Measurement | Yup'ik | Trinidadian and Tobagonian |
| Minimum | 1.6% | 0.70% |
| Maximum | 39.6% | 12.0% |
| Range | 38.0% | 11.3% |
| Mean | 15.8% | 6.4% |
| Median | 16.2% | 6.3% |
| Interquartile 25% (IQ1) | 6.9% | 5.3% |
| Interquartile 75% (IQ3) | 23.2% | 8.1% |
| Interquartile Range (IQR) | 16.3% | 2.7% |
| Standard Deviation (Sample) | 9.5% | 2.6% |
| Standard Deviation (Population) | 9.4% | 2.6% |
Similar Demographics by Unemployment
Demographics Similar to Yup'ik by Unemployment
In terms of unemployment, the demographic groups most similar to Yup'ik are Crow (11.1%, a difference of 23.3%), Inupiat (10.1%, a difference of 34.8%), Arapaho (9.8%, a difference of 38.8%), Yuman (9.1%, a difference of 50.4%), and Hopi (8.9%, a difference of 53.0%).
| Demographics | Rating | Rank | Unemployment |
| Immigrants | Dominican Republic | 0.0 /100 | #333 | Tragic 7.4% |
| Apache | 0.0 /100 | #334 | Tragic 7.4% |
| Alaskan Athabascans | 0.0 /100 | #335 | Tragic 7.7% |
| Immigrants | Yemen | 0.0 /100 | #336 | Tragic 7.7% |
| Cheyenne | 0.0 /100 | #337 | Tragic 8.0% |
| Pima | 0.0 /100 | #338 | Tragic 8.2% |
| Navajo | 0.0 /100 | #339 | Tragic 8.4% |
| Puerto Ricans | 0.0 /100 | #340 | Tragic 8.4% |
| Tohono O'odham | 0.0 /100 | #341 | Tragic 8.9% |
| Hopi | 0.0 /100 | #342 | Tragic 8.9% |
| Yuman | 0.0 /100 | #343 | Tragic 9.1% |
| Arapaho | 0.0 /100 | #344 | Tragic 9.8% |
| Inupiat | 0.0 /100 | #345 | Tragic 10.1% |
| Crow | 0.0 /100 | #346 | Tragic 11.1% |
| Yup'ik | 0.0 /100 | #347 | Tragic 13.6% |
Demographics Similar to Trinidadians and Tobagonians by Unemployment
In terms of unemployment, the demographic groups most similar to Trinidadians and Tobagonians are West Indian (6.4%, a difference of 0.25%), Immigrants from Trinidad and Tobago (6.3%, a difference of 0.48%), Belizean (6.4%, a difference of 0.48%), Immigrants from West Indies (6.3%, a difference of 0.60%), and Immigrants from Haiti (6.3%, a difference of 0.65%).
| Demographics | Rating | Rank | Unemployment |
| Spanish American Indians | 0.0 /100 | #294 | Tragic 6.2% |
| U.S. Virgin Islanders | 0.0 /100 | #295 | Tragic 6.3% |
| Ute | 0.0 /100 | #296 | Tragic 6.3% |
| Jamaicans | 0.0 /100 | #297 | Tragic 6.3% |
| Immigrants | Haiti | 0.0 /100 | #298 | Tragic 6.3% |
| Immigrants | West Indies | 0.0 /100 | #299 | Tragic 6.3% |
| Immigrants | Trinidad and Tobago | 0.0 /100 | #300 | Tragic 6.3% |
| Trinidadians and Tobagonians | 0.0 /100 | #301 | Tragic 6.3% |
| West Indians | 0.0 /100 | #302 | Tragic 6.4% |
| Belizeans | 0.0 /100 | #303 | Tragic 6.4% |
| Immigrants | Jamaica | 0.0 /100 | #304 | Tragic 6.4% |
| Menominee | 0.0 /100 | #305 | Tragic 6.4% |
| Lumbee | 0.0 /100 | #306 | Tragic 6.4% |
| Immigrants | Bangladesh | 0.0 /100 | #307 | Tragic 6.5% |
| Barbadians | 0.0 /100 | #308 | Tragic 6.5% |