Japanese vs Bermudan Unemployment
COMPARE
Japanese
Bermudan
Unemployment
Unemployment Comparison
Japanese
Bermudans
5.6%
UNEMPLOYMENT
0.8/ 100
METRIC RATING
250th/ 347
METRIC RANK
5.6%
UNEMPLOYMENT
1.1/ 100
METRIC RATING
246th/ 347
METRIC RANK
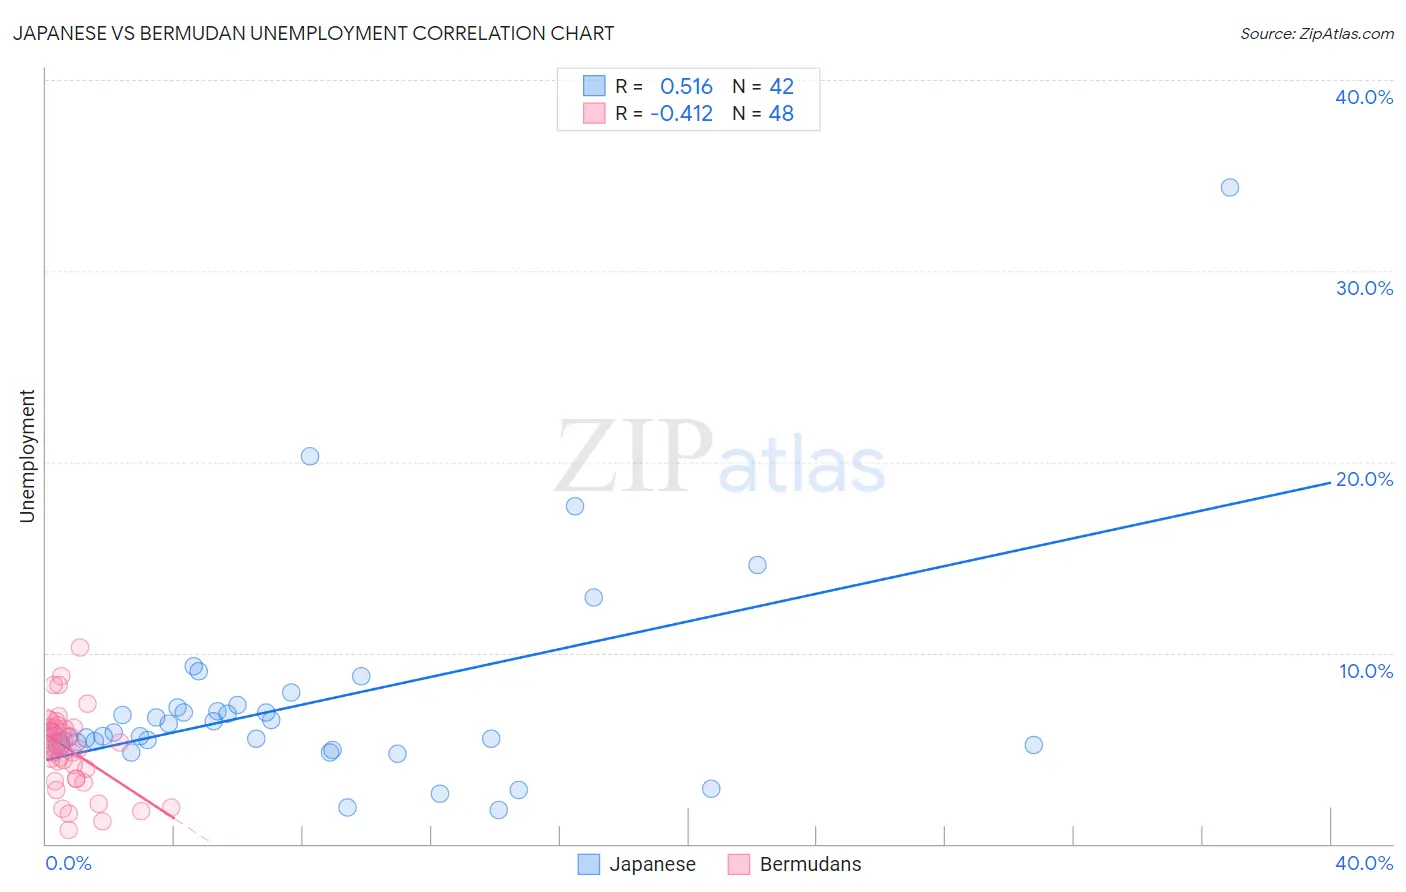
Japanese vs Bermudan Unemployment Correlation Chart
The statistical analysis conducted on geographies consisting of 249,076,576 people shows a substantial positive correlation between the proportion of Japanese and unemployment in the United States with a correlation coefficient (R) of 0.516 and weighted average of 5.6%. Similarly, the statistical analysis conducted on geographies consisting of 55,703,293 people shows a moderate negative correlation between the proportion of Bermudans and unemployment in the United States with a correlation coefficient (R) of -0.412 and weighted average of 5.6%, a difference of 0.55%.
Unemployment Correlation Summary
| Measurement | Japanese | Bermudan |
| Minimum | 1.8% | 0.70% |
| Maximum | 34.4% | 10.3% |
| Range | 32.6% | 9.6% |
| Mean | 7.4% | 4.9% |
| Median | 5.8% | 5.1% |
| Interquartile 25% (IQ1) | 5.2% | 3.6% |
| Interquartile 75% (IQ3) | 7.1% | 6.1% |
| Interquartile Range (IQR) | 1.9% | 2.4% |
| Standard Deviation (Sample) | 5.6% | 2.0% |
| Standard Deviation (Population) | 5.6% | 2.0% |
Demographics Similar to Japanese and Bermudans by Unemployment
In terms of unemployment, the demographic groups most similar to Japanese are Cajun (5.6%, a difference of 0.010%), Liberian (5.6%, a difference of 0.27%), Immigrants from Cameroon (5.6%, a difference of 0.40%), Kiowa (5.7%, a difference of 0.47%), and French American Indian (5.6%, a difference of 0.59%). Similarly, the demographic groups most similar to Bermudans are French American Indian (5.6%, a difference of 0.050%), Dutch West Indian (5.6%, a difference of 0.070%), Immigrants from Cameroon (5.6%, a difference of 0.15%), Marshallese (5.6%, a difference of 0.22%), and Liberian (5.6%, a difference of 0.28%).
| Demographics | Rating | Rank | Unemployment |
| Immigrants | Western Asia | 2.8 /100 | #238 | Tragic 5.5% |
| Immigrants | Immigrants | 2.6 /100 | #239 | Tragic 5.5% |
| Cree | 2.6 /100 | #240 | Tragic 5.6% |
| Tlingit-Haida | 2.0 /100 | #241 | Tragic 5.6% |
| Spanish Americans | 2.0 /100 | #242 | Tragic 5.6% |
| Marshallese | 1.3 /100 | #243 | Tragic 5.6% |
| Dutch West Indians | 1.2 /100 | #244 | Tragic 5.6% |
| French American Indians | 1.2 /100 | #245 | Tragic 5.6% |
| Bermudans | 1.1 /100 | #246 | Tragic 5.6% |
| Immigrants | Cameroon | 1.0 /100 | #247 | Tragic 5.6% |
| Liberians | 0.9 /100 | #248 | Tragic 5.6% |
| Cajuns | 0.8 /100 | #249 | Tragic 5.6% |
| Japanese | 0.8 /100 | #250 | Tragic 5.6% |
| Kiowa | 0.6 /100 | #251 | Tragic 5.7% |
| Hondurans | 0.3 /100 | #252 | Tragic 5.7% |
| Central Americans | 0.3 /100 | #253 | Tragic 5.7% |
| Immigrants | Honduras | 0.3 /100 | #254 | Tragic 5.7% |
| Immigrants | Portugal | 0.2 /100 | #255 | Tragic 5.7% |
| Guatemalans | 0.2 /100 | #256 | Tragic 5.8% |
| Yaqui | 0.2 /100 | #257 | Tragic 5.8% |
| Immigrants | Bahamas | 0.1 /100 | #258 | Tragic 5.8% |