Japanese vs Immigrants from South Eastern Asia Female Unemployment
COMPARE
Japanese
Immigrants from South Eastern Asia
Female Unemployment
Female Unemployment Comparison
Japanese
Immigrants from South Eastern Asia
5.6%
FEMALE UNEMPLOYMENT
1.2/ 100
METRIC RATING
246th/ 347
METRIC RANK
5.4%
FEMALE UNEMPLOYMENT
20.3/ 100
METRIC RATING
203rd/ 347
METRIC RANK
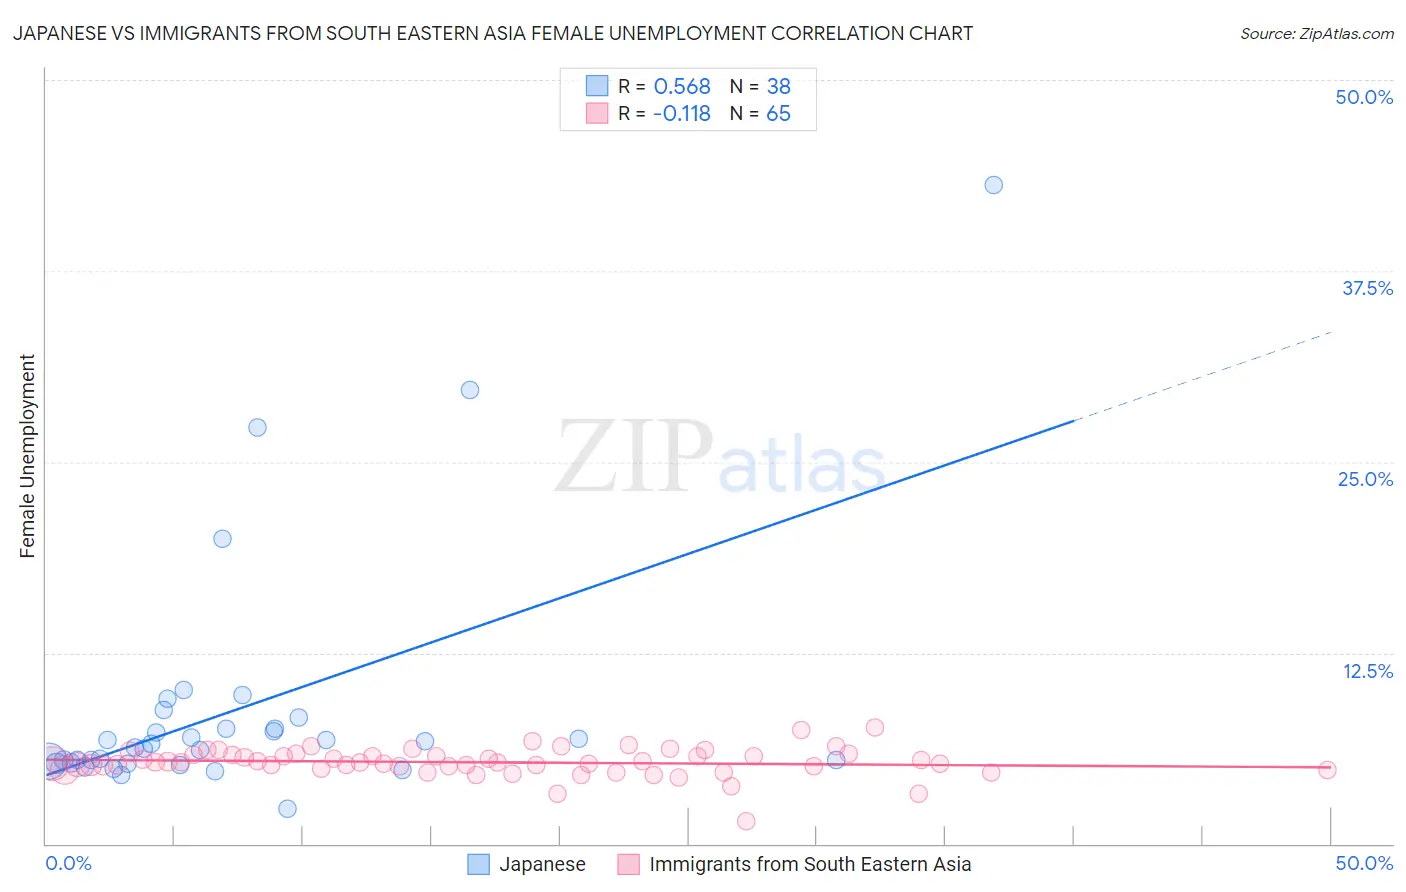
Japanese vs Immigrants from South Eastern Asia Female Unemployment Correlation Chart
The statistical analysis conducted on geographies consisting of 248,709,306 people shows a substantial positive correlation between the proportion of Japanese and unemploymnet rate among females in the United States with a correlation coefficient (R) of 0.568 and weighted average of 5.6%. Similarly, the statistical analysis conducted on geographies consisting of 507,584,627 people shows a poor negative correlation between the proportion of Immigrants from South Eastern Asia and unemploymnet rate among females in the United States with a correlation coefficient (R) of -0.118 and weighted average of 5.4%, a difference of 4.5%.
Female Unemployment Correlation Summary
| Measurement | Japanese | Immigrants from South Eastern Asia |
| Minimum | 2.3% | 1.5% |
| Maximum | 43.1% | 7.6% |
| Range | 40.8% | 6.1% |
| Mean | 8.8% | 5.3% |
| Median | 6.4% | 5.3% |
| Interquartile 25% (IQ1) | 5.3% | 5.0% |
| Interquartile 75% (IQ3) | 7.5% | 5.8% |
| Interquartile Range (IQR) | 2.3% | 0.85% |
| Standard Deviation (Sample) | 8.0% | 0.92% |
| Standard Deviation (Population) | 7.9% | 0.91% |
Similar Demographics by Female Unemployment
Demographics Similar to Japanese by Female Unemployment
In terms of female unemployment, the demographic groups most similar to Japanese are Immigrants from Western Asia (5.6%, a difference of 0.080%), Guamanian/Chamorro (5.6%, a difference of 0.23%), Cree (5.6%, a difference of 0.24%), Immigrants from Uzbekistan (5.6%, a difference of 0.28%), and Immigrants from Liberia (5.6%, a difference of 0.37%).
| Demographics | Rating | Rank | Female Unemployment |
| Aleuts | 3.0 /100 | #239 | Tragic 5.5% |
| Immigrants | South America | 2.9 /100 | #240 | Tragic 5.5% |
| South American Indians | 2.8 /100 | #241 | Tragic 5.5% |
| Marshallese | 2.3 /100 | #242 | Tragic 5.6% |
| Spanish Americans | 2.2 /100 | #243 | Tragic 5.6% |
| Immigrants | Liberia | 1.5 /100 | #244 | Tragic 5.6% |
| Guamanians/Chamorros | 1.4 /100 | #245 | Tragic 5.6% |
| Japanese | 1.2 /100 | #246 | Tragic 5.6% |
| Immigrants | Western Asia | 1.1 /100 | #247 | Tragic 5.6% |
| Cree | 1.0 /100 | #248 | Tragic 5.6% |
| Immigrants | Uzbekistan | 1.0 /100 | #249 | Tragic 5.6% |
| Immigrants | Syria | 0.8 /100 | #250 | Tragic 5.6% |
| Assyrians/Chaldeans/Syriacs | 0.8 /100 | #251 | Tragic 5.6% |
| Cajuns | 0.7 /100 | #252 | Tragic 5.7% |
| Immigrants | Sierra Leone | 0.6 /100 | #253 | Tragic 5.7% |
Demographics Similar to Immigrants from South Eastern Asia by Female Unemployment
In terms of female unemployment, the demographic groups most similar to Immigrants from South Eastern Asia are Immigrants from Middle Africa (5.4%, a difference of 0.040%), Iroquois (5.4%, a difference of 0.040%), Immigrants from Israel (5.4%, a difference of 0.060%), Soviet Union (5.4%, a difference of 0.12%), and Immigrants from Afghanistan (5.4%, a difference of 0.13%).
| Demographics | Rating | Rank | Female Unemployment |
| Spaniards | 25.2 /100 | #196 | Fair 5.3% |
| Alsatians | 23.9 /100 | #197 | Fair 5.3% |
| Tsimshian | 23.1 /100 | #198 | Fair 5.4% |
| Hawaiians | 22.2 /100 | #199 | Fair 5.4% |
| Soviet Union | 21.7 /100 | #200 | Fair 5.4% |
| Immigrants | Middle Africa | 20.8 /100 | #201 | Fair 5.4% |
| Iroquois | 20.8 /100 | #202 | Fair 5.4% |
| Immigrants | South Eastern Asia | 20.3 /100 | #203 | Fair 5.4% |
| Immigrants | Israel | 19.7 /100 | #204 | Poor 5.4% |
| Immigrants | Afghanistan | 18.9 /100 | #205 | Poor 5.4% |
| Immigrants | Brazil | 18.8 /100 | #206 | Poor 5.4% |
| Creek | 15.4 /100 | #207 | Poor 5.4% |
| Immigrants | Costa Rica | 13.7 /100 | #208 | Poor 5.4% |
| Koreans | 13.4 /100 | #209 | Poor 5.4% |
| Choctaw | 12.3 /100 | #210 | Poor 5.4% |