Apache vs Immigrants from Germany Female Unemployment
COMPARE
Apache
Immigrants from Germany
Female Unemployment
Female Unemployment Comparison
Apache
Immigrants from Germany
6.6%
FEMALE UNEMPLOYMENT
0.0/ 100
METRIC RATING
325th/ 347
METRIC RANK
5.1%
FEMALE UNEMPLOYMENT
87.6/ 100
METRIC RATING
122nd/ 347
METRIC RANK
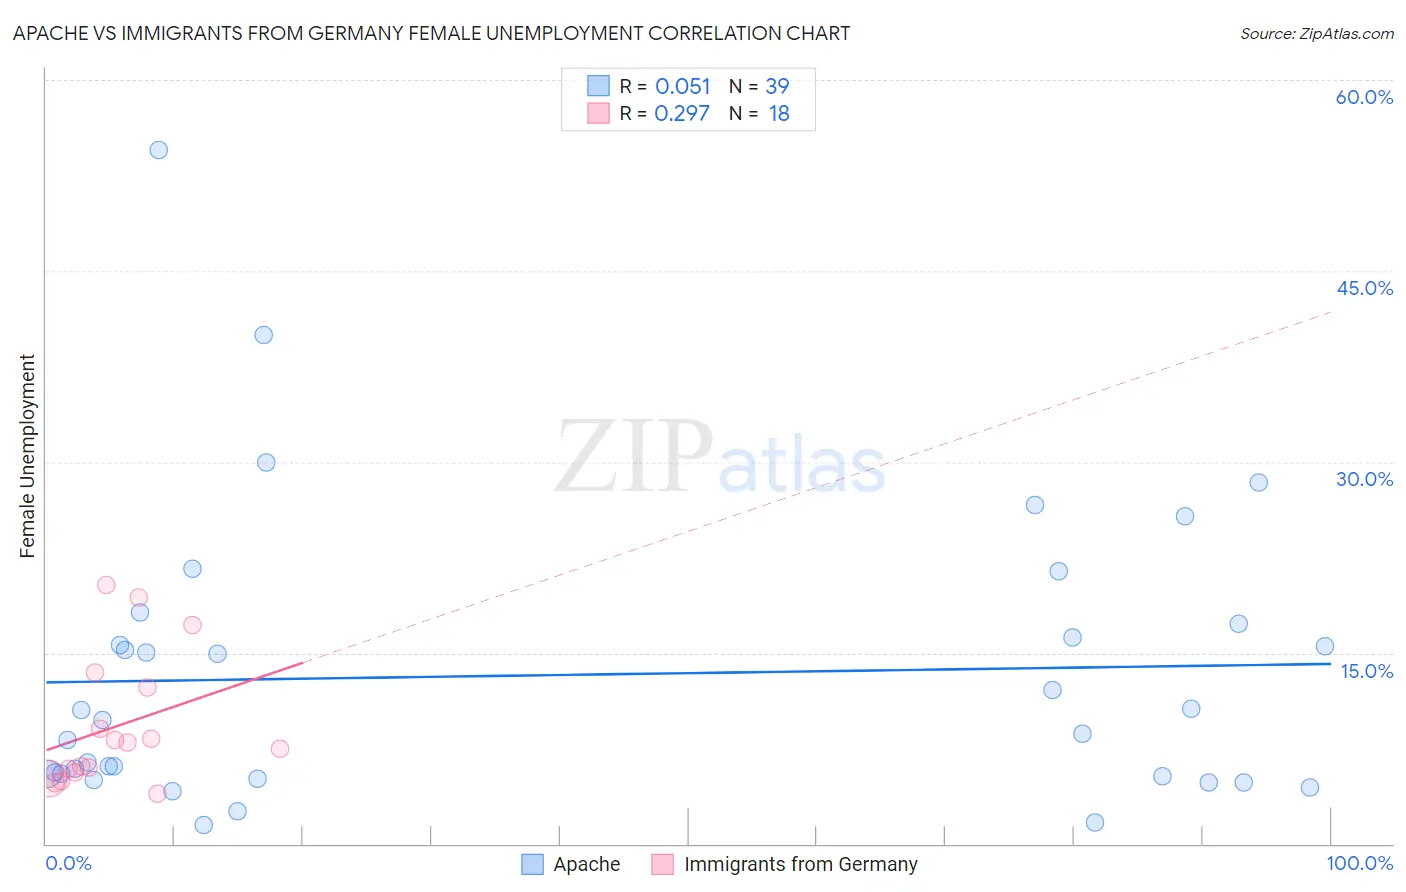
Apache vs Immigrants from Germany Female Unemployment Correlation Chart
The statistical analysis conducted on geographies consisting of 230,279,610 people shows a slight positive correlation between the proportion of Apache and unemploymnet rate among females in the United States with a correlation coefficient (R) of 0.051 and weighted average of 6.6%. Similarly, the statistical analysis conducted on geographies consisting of 460,161,850 people shows a weak positive correlation between the proportion of Immigrants from Germany and unemploymnet rate among females in the United States with a correlation coefficient (R) of 0.297 and weighted average of 5.1%, a difference of 29.1%.
Female Unemployment Correlation Summary
| Measurement | Apache | Immigrants from Germany |
| Minimum | 1.5% | 4.0% |
| Maximum | 54.5% | 20.3% |
| Range | 53.0% | 16.4% |
| Mean | 13.2% | 9.2% |
| Median | 9.7% | 7.7% |
| Interquartile 25% (IQ1) | 5.3% | 5.6% |
| Interquartile 75% (IQ3) | 17.3% | 12.3% |
| Interquartile Range (IQR) | 12.0% | 6.6% |
| Standard Deviation (Sample) | 11.3% | 5.1% |
| Standard Deviation (Population) | 11.1% | 5.0% |
Similar Demographics by Female Unemployment
Demographics Similar to Apache by Female Unemployment
In terms of female unemployment, the demographic groups most similar to Apache are Cheyenne (6.6%, a difference of 0.27%), Native/Alaskan (6.6%, a difference of 0.56%), Alaska Native (6.6%, a difference of 0.64%), Guyanese (6.7%, a difference of 1.1%), and Immigrants from Belize (6.5%, a difference of 1.3%).
| Demographics | Rating | Rank | Female Unemployment |
| British West Indians | 0.0 /100 | #318 | Tragic 6.4% |
| Immigrants | Bangladesh | 0.0 /100 | #319 | Tragic 6.5% |
| Immigrants | Dominica | 0.0 /100 | #320 | Tragic 6.5% |
| Blacks/African Americans | 0.0 /100 | #321 | Tragic 6.5% |
| Vietnamese | 0.0 /100 | #322 | Tragic 6.5% |
| Immigrants | Belize | 0.0 /100 | #323 | Tragic 6.5% |
| Cheyenne | 0.0 /100 | #324 | Tragic 6.6% |
| Apache | 0.0 /100 | #325 | Tragic 6.6% |
| Natives/Alaskans | 0.0 /100 | #326 | Tragic 6.6% |
| Alaska Natives | 0.0 /100 | #327 | Tragic 6.6% |
| Guyanese | 0.0 /100 | #328 | Tragic 6.7% |
| Immigrants | Guyana | 0.0 /100 | #329 | Tragic 6.7% |
| Yakama | 0.0 /100 | #330 | Tragic 6.7% |
| Paiute | 0.0 /100 | #331 | Tragic 6.8% |
| Sioux | 0.0 /100 | #332 | Tragic 7.0% |
Demographics Similar to Immigrants from Germany by Female Unemployment
In terms of female unemployment, the demographic groups most similar to Immigrants from Germany are Immigrants from South Africa (5.1%, a difference of 0.0%), Immigrants from Europe (5.1%, a difference of 0.050%), Immigrants from Romania (5.1%, a difference of 0.080%), Immigrants from Western Europe (5.1%, a difference of 0.080%), and Immigrants from North Macedonia (5.1%, a difference of 0.10%).
| Demographics | Rating | Rank | Female Unemployment |
| Lebanese | 91.0 /100 | #115 | Exceptional 5.1% |
| Americans | 90.5 /100 | #116 | Exceptional 5.1% |
| Jordanians | 90.3 /100 | #117 | Exceptional 5.1% |
| Immigrants | Croatia | 89.9 /100 | #118 | Excellent 5.1% |
| Immigrants | North Macedonia | 88.3 /100 | #119 | Excellent 5.1% |
| Immigrants | Romania | 88.1 /100 | #120 | Excellent 5.1% |
| Immigrants | Western Europe | 88.1 /100 | #121 | Excellent 5.1% |
| Immigrants | Germany | 87.6 /100 | #122 | Excellent 5.1% |
| Immigrants | South Africa | 87.6 /100 | #123 | Excellent 5.1% |
| Immigrants | Europe | 87.2 /100 | #124 | Excellent 5.1% |
| Basques | 86.5 /100 | #125 | Excellent 5.1% |
| Immigrants | Korea | 86.3 /100 | #126 | Excellent 5.1% |
| Immigrants | Hungary | 86.0 /100 | #127 | Excellent 5.1% |
| Chileans | 85.8 /100 | #128 | Excellent 5.1% |
| Ethiopians | 85.7 /100 | #129 | Excellent 5.1% |