Irish vs Immigrants from Germany Female Unemployment
COMPARE
Irish
Immigrants from Germany
Female Unemployment
Female Unemployment Comparison
Irish
Immigrants from Germany
4.7%
FEMALE UNEMPLOYMENT
99.9/ 100
METRIC RATING
28th/ 347
METRIC RANK
5.1%
FEMALE UNEMPLOYMENT
87.6/ 100
METRIC RATING
122nd/ 347
METRIC RANK
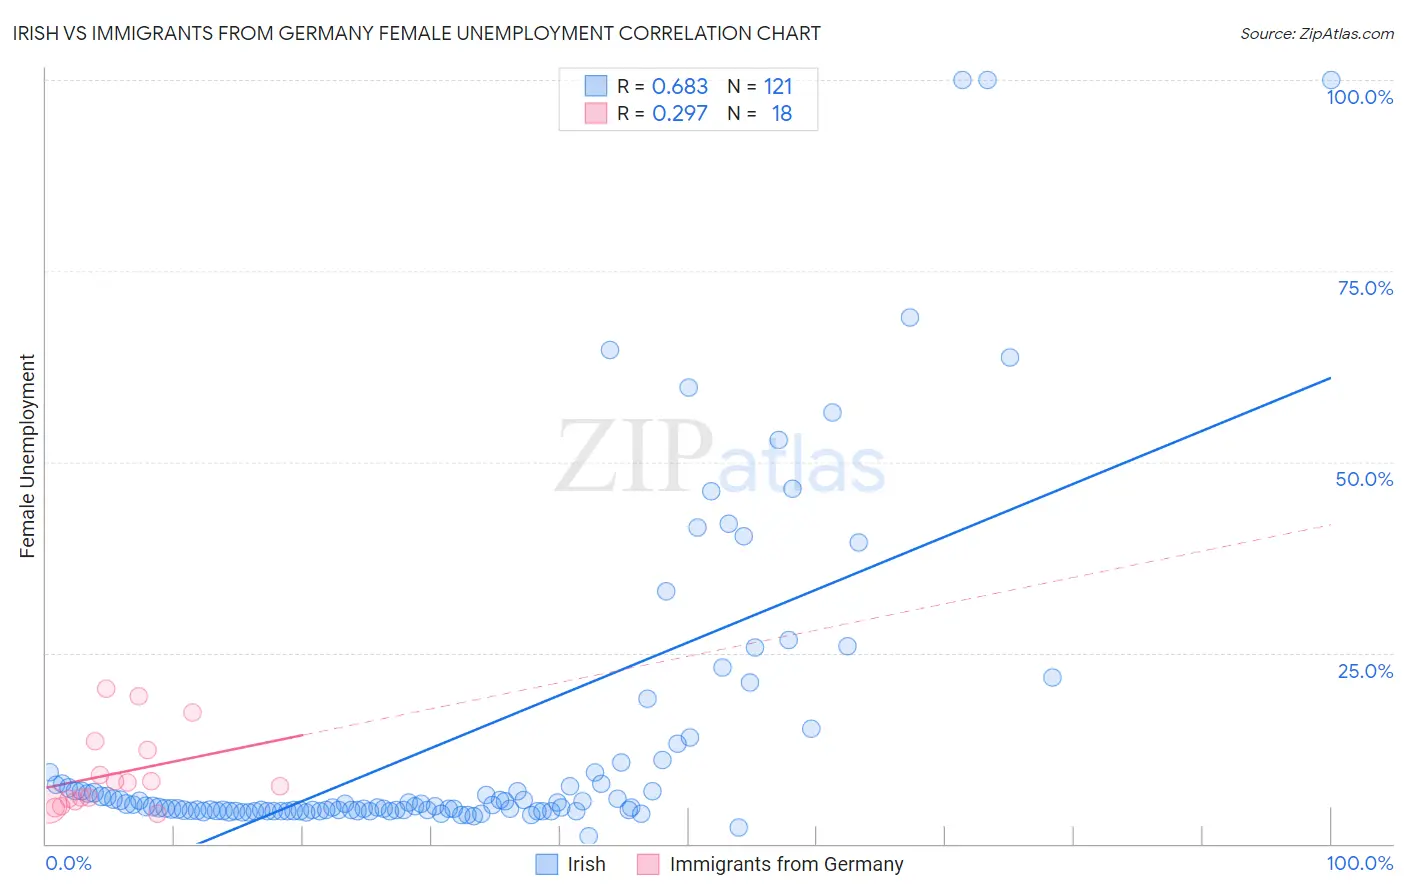
Irish vs Immigrants from Germany Female Unemployment Correlation Chart
The statistical analysis conducted on geographies consisting of 563,665,883 people shows a significant positive correlation between the proportion of Irish and unemploymnet rate among females in the United States with a correlation coefficient (R) of 0.683 and weighted average of 4.7%. Similarly, the statistical analysis conducted on geographies consisting of 460,161,850 people shows a weak positive correlation between the proportion of Immigrants from Germany and unemploymnet rate among females in the United States with a correlation coefficient (R) of 0.297 and weighted average of 5.1%, a difference of 7.7%.
Female Unemployment Correlation Summary
| Measurement | Irish | Immigrants from Germany |
| Minimum | 1.0% | 4.0% |
| Maximum | 100.0% | 20.3% |
| Range | 99.0% | 16.4% |
| Mean | 13.6% | 9.2% |
| Median | 4.9% | 7.7% |
| Interquartile 25% (IQ1) | 4.3% | 5.6% |
| Interquartile 75% (IQ3) | 8.6% | 12.3% |
| Interquartile Range (IQR) | 4.2% | 6.6% |
| Standard Deviation (Sample) | 20.3% | 5.1% |
| Standard Deviation (Population) | 20.2% | 5.0% |
Similar Demographics by Female Unemployment
Demographics Similar to Irish by Female Unemployment
In terms of female unemployment, the demographic groups most similar to Irish are Cypriot (4.7%, a difference of 0.010%), British (4.7%, a difference of 0.030%), Lithuanian (4.7%, a difference of 0.13%), Immigrants from Bosnia and Herzegovina (4.7%, a difference of 0.20%), and Immigrants from India (4.7%, a difference of 0.24%).
| Demographics | Rating | Rank | Female Unemployment |
| Fijians | 99.9 /100 | #21 | Exceptional 4.7% |
| Europeans | 99.9 /100 | #22 | Exceptional 4.7% |
| Scottish | 99.9 /100 | #23 | Exceptional 4.7% |
| Welsh | 99.9 /100 | #24 | Exceptional 4.7% |
| Immigrants | India | 99.9 /100 | #25 | Exceptional 4.7% |
| Immigrants | Bosnia and Herzegovina | 99.9 /100 | #26 | Exceptional 4.7% |
| British | 99.9 /100 | #27 | Exceptional 4.7% |
| Irish | 99.9 /100 | #28 | Exceptional 4.7% |
| Cypriots | 99.9 /100 | #29 | Exceptional 4.7% |
| Lithuanians | 99.8 /100 | #30 | Exceptional 4.7% |
| Sudanese | 99.8 /100 | #31 | Exceptional 4.8% |
| Slovaks | 99.8 /100 | #32 | Exceptional 4.8% |
| Czechoslovakians | 99.7 /100 | #33 | Exceptional 4.8% |
| Zimbabweans | 99.7 /100 | #34 | Exceptional 4.8% |
| French Canadians | 99.7 /100 | #35 | Exceptional 4.8% |
Demographics Similar to Immigrants from Germany by Female Unemployment
In terms of female unemployment, the demographic groups most similar to Immigrants from Germany are Immigrants from South Africa (5.1%, a difference of 0.0%), Immigrants from Europe (5.1%, a difference of 0.050%), Immigrants from Romania (5.1%, a difference of 0.080%), Immigrants from Western Europe (5.1%, a difference of 0.080%), and Immigrants from North Macedonia (5.1%, a difference of 0.10%).
| Demographics | Rating | Rank | Female Unemployment |
| Lebanese | 91.0 /100 | #115 | Exceptional 5.1% |
| Americans | 90.5 /100 | #116 | Exceptional 5.1% |
| Jordanians | 90.3 /100 | #117 | Exceptional 5.1% |
| Immigrants | Croatia | 89.9 /100 | #118 | Excellent 5.1% |
| Immigrants | North Macedonia | 88.3 /100 | #119 | Excellent 5.1% |
| Immigrants | Romania | 88.1 /100 | #120 | Excellent 5.1% |
| Immigrants | Western Europe | 88.1 /100 | #121 | Excellent 5.1% |
| Immigrants | Germany | 87.6 /100 | #122 | Excellent 5.1% |
| Immigrants | South Africa | 87.6 /100 | #123 | Excellent 5.1% |
| Immigrants | Europe | 87.2 /100 | #124 | Excellent 5.1% |
| Basques | 86.5 /100 | #125 | Excellent 5.1% |
| Immigrants | Korea | 86.3 /100 | #126 | Excellent 5.1% |
| Immigrants | Hungary | 86.0 /100 | #127 | Excellent 5.1% |
| Chileans | 85.8 /100 | #128 | Excellent 5.1% |
| Ethiopians | 85.7 /100 | #129 | Excellent 5.1% |