Soviet Union vs Immigrants from Germany Female Unemployment
COMPARE
Soviet Union
Immigrants from Germany
Female Unemployment
Female Unemployment Comparison
Soviet Union
Immigrants from Germany
5.4%
FEMALE UNEMPLOYMENT
21.7/ 100
METRIC RATING
200th/ 347
METRIC RANK
5.1%
FEMALE UNEMPLOYMENT
87.6/ 100
METRIC RATING
122nd/ 347
METRIC RANK
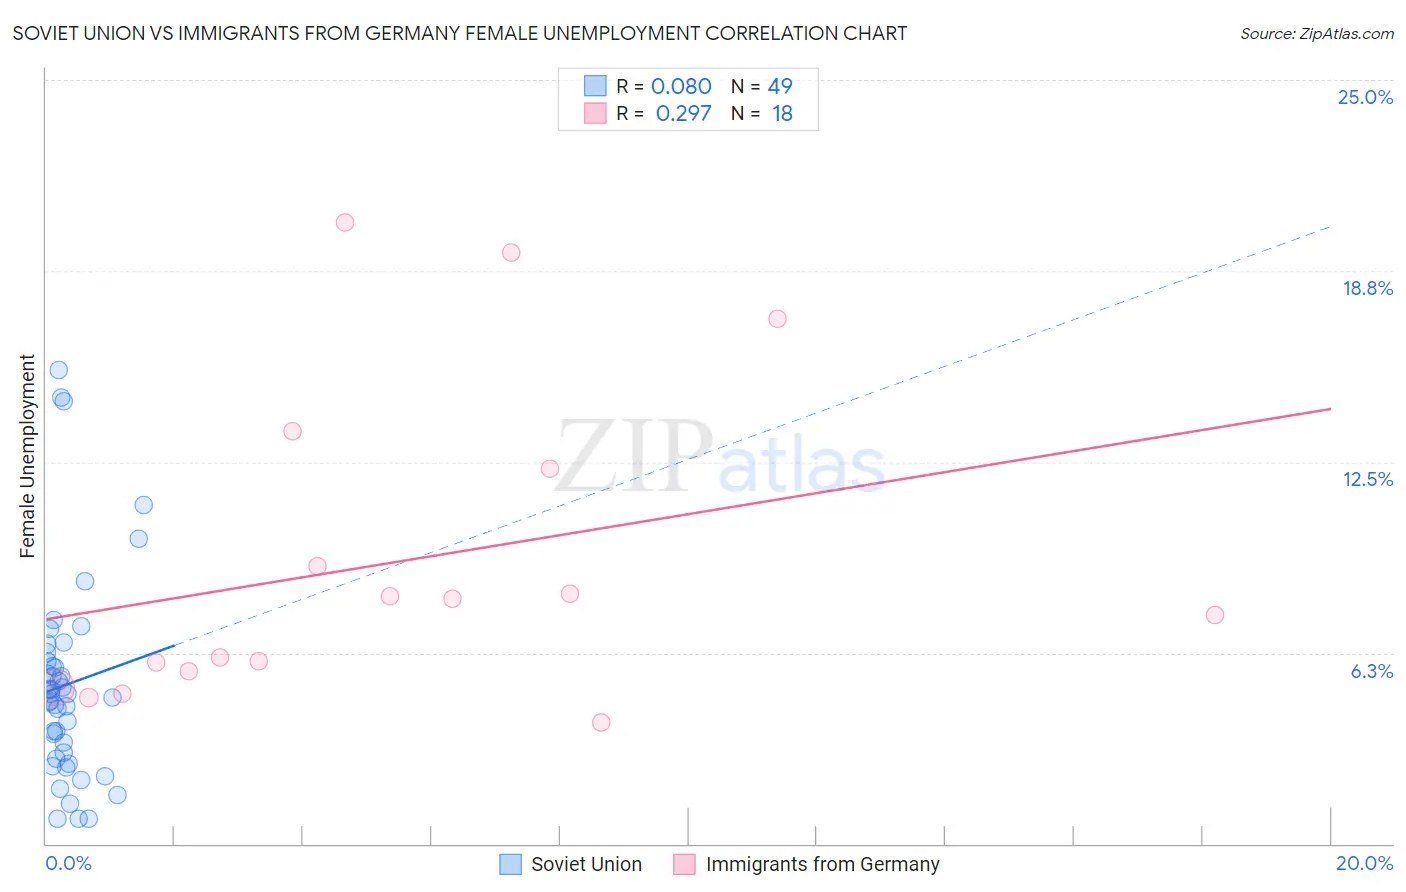
Soviet Union vs Immigrants from Germany Female Unemployment Correlation Chart
The statistical analysis conducted on geographies consisting of 43,498,217 people shows a slight positive correlation between the proportion of Soviet Union and unemploymnet rate among females in the United States with a correlation coefficient (R) of 0.080 and weighted average of 5.4%. Similarly, the statistical analysis conducted on geographies consisting of 460,161,850 people shows a weak positive correlation between the proportion of Immigrants from Germany and unemploymnet rate among females in the United States with a correlation coefficient (R) of 0.297 and weighted average of 5.1%, a difference of 5.0%.
Female Unemployment Correlation Summary
| Measurement | Soviet Union | Immigrants from Germany |
| Minimum | 0.80% | 4.0% |
| Maximum | 15.5% | 20.3% |
| Range | 14.7% | 16.4% |
| Mean | 5.2% | 9.2% |
| Median | 4.9% | 7.7% |
| Interquartile 25% (IQ1) | 2.9% | 5.6% |
| Interquartile 75% (IQ3) | 6.1% | 12.3% |
| Interquartile Range (IQR) | 3.2% | 6.6% |
| Standard Deviation (Sample) | 3.3% | 5.1% |
| Standard Deviation (Population) | 3.3% | 5.0% |
Similar Demographics by Female Unemployment
Demographics Similar to Soviet Union by Female Unemployment
In terms of female unemployment, the demographic groups most similar to Soviet Union are Hawaiian (5.4%, a difference of 0.040%), Immigrants from Middle Africa (5.4%, a difference of 0.080%), Iroquois (5.4%, a difference of 0.080%), Tsimshian (5.4%, a difference of 0.12%), and Immigrants from South Eastern Asia (5.4%, a difference of 0.12%).
| Demographics | Rating | Rank | Female Unemployment |
| Arabs | 27.7 /100 | #193 | Fair 5.3% |
| Colombians | 27.0 /100 | #194 | Fair 5.3% |
| Immigrants | Colombia | 26.2 /100 | #195 | Fair 5.3% |
| Spaniards | 25.2 /100 | #196 | Fair 5.3% |
| Alsatians | 23.9 /100 | #197 | Fair 5.3% |
| Tsimshian | 23.1 /100 | #198 | Fair 5.4% |
| Hawaiians | 22.2 /100 | #199 | Fair 5.4% |
| Soviet Union | 21.7 /100 | #200 | Fair 5.4% |
| Immigrants | Middle Africa | 20.8 /100 | #201 | Fair 5.4% |
| Iroquois | 20.8 /100 | #202 | Fair 5.4% |
| Immigrants | South Eastern Asia | 20.3 /100 | #203 | Fair 5.4% |
| Immigrants | Israel | 19.7 /100 | #204 | Poor 5.4% |
| Immigrants | Afghanistan | 18.9 /100 | #205 | Poor 5.4% |
| Immigrants | Brazil | 18.8 /100 | #206 | Poor 5.4% |
| Creek | 15.4 /100 | #207 | Poor 5.4% |
Demographics Similar to Immigrants from Germany by Female Unemployment
In terms of female unemployment, the demographic groups most similar to Immigrants from Germany are Immigrants from South Africa (5.1%, a difference of 0.0%), Immigrants from Europe (5.1%, a difference of 0.050%), Immigrants from Romania (5.1%, a difference of 0.080%), Immigrants from Western Europe (5.1%, a difference of 0.080%), and Immigrants from North Macedonia (5.1%, a difference of 0.10%).
| Demographics | Rating | Rank | Female Unemployment |
| Lebanese | 91.0 /100 | #115 | Exceptional 5.1% |
| Americans | 90.5 /100 | #116 | Exceptional 5.1% |
| Jordanians | 90.3 /100 | #117 | Exceptional 5.1% |
| Immigrants | Croatia | 89.9 /100 | #118 | Excellent 5.1% |
| Immigrants | North Macedonia | 88.3 /100 | #119 | Excellent 5.1% |
| Immigrants | Romania | 88.1 /100 | #120 | Excellent 5.1% |
| Immigrants | Western Europe | 88.1 /100 | #121 | Excellent 5.1% |
| Immigrants | Germany | 87.6 /100 | #122 | Excellent 5.1% |
| Immigrants | South Africa | 87.6 /100 | #123 | Excellent 5.1% |
| Immigrants | Europe | 87.2 /100 | #124 | Excellent 5.1% |
| Basques | 86.5 /100 | #125 | Excellent 5.1% |
| Immigrants | Korea | 86.3 /100 | #126 | Excellent 5.1% |
| Immigrants | Hungary | 86.0 /100 | #127 | Excellent 5.1% |
| Chileans | 85.8 /100 | #128 | Excellent 5.1% |
| Ethiopians | 85.7 /100 | #129 | Excellent 5.1% |