Japanese vs Bangladeshi Female Unemployment
COMPARE
Japanese
Bangladeshi
Female Unemployment
Female Unemployment Comparison
Japanese
Bangladeshis
5.6%
FEMALE UNEMPLOYMENT
1.2/ 100
METRIC RATING
246th/ 347
METRIC RANK
5.2%
FEMALE UNEMPLOYMENT
64.3/ 100
METRIC RATING
164th/ 347
METRIC RANK
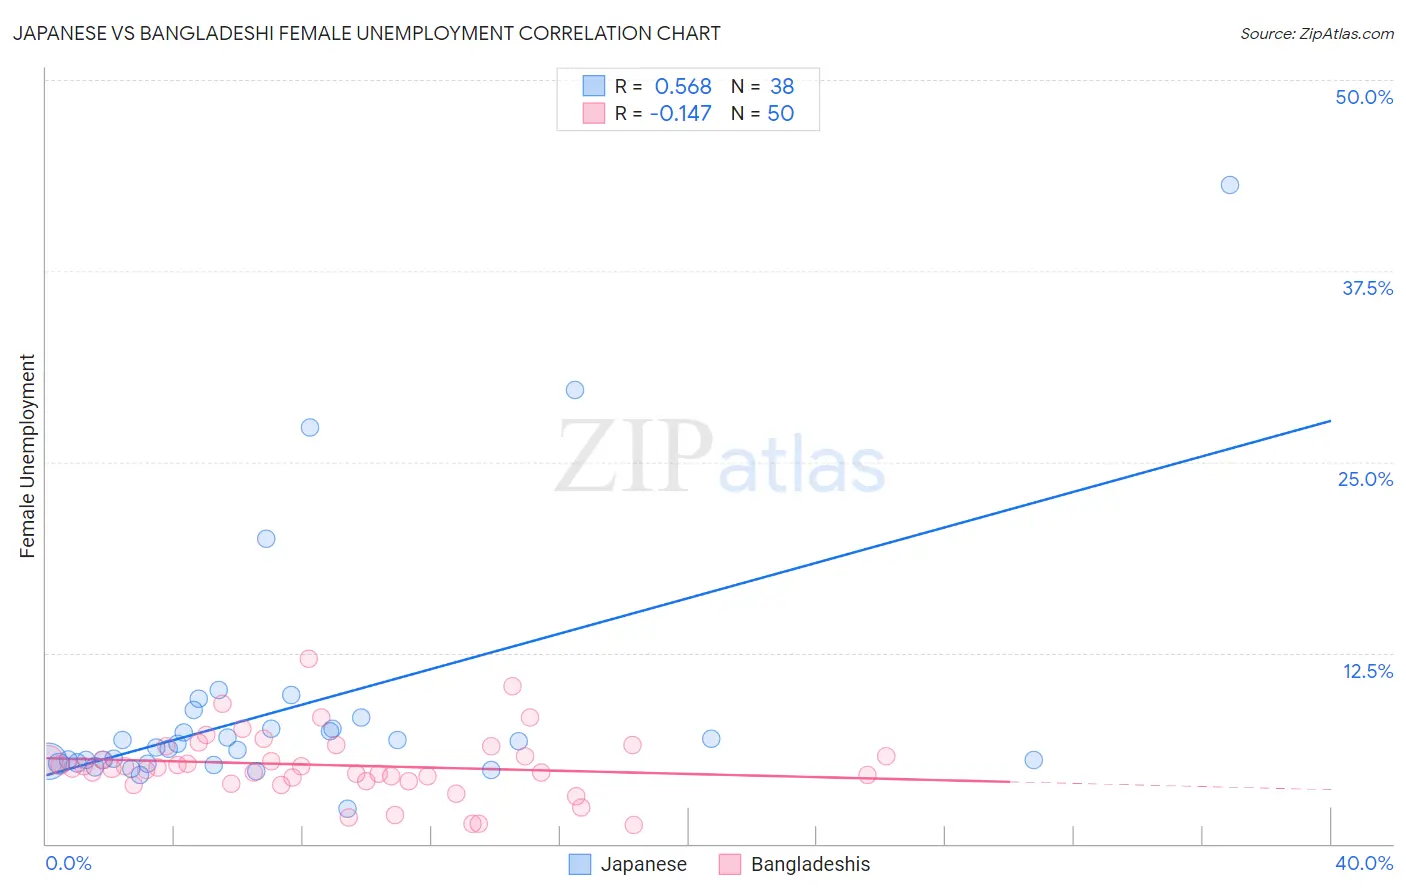
Japanese vs Bangladeshi Female Unemployment Correlation Chart
The statistical analysis conducted on geographies consisting of 248,709,306 people shows a substantial positive correlation between the proportion of Japanese and unemploymnet rate among females in the United States with a correlation coefficient (R) of 0.568 and weighted average of 5.6%. Similarly, the statistical analysis conducted on geographies consisting of 141,088,133 people shows a poor negative correlation between the proportion of Bangladeshis and unemploymnet rate among females in the United States with a correlation coefficient (R) of -0.147 and weighted average of 5.2%, a difference of 7.6%.
Female Unemployment Correlation Summary
| Measurement | Japanese | Bangladeshi |
| Minimum | 2.3% | 1.2% |
| Maximum | 43.1% | 12.1% |
| Range | 40.8% | 10.9% |
| Mean | 8.8% | 5.1% |
| Median | 6.4% | 5.0% |
| Interquartile 25% (IQ1) | 5.3% | 4.1% |
| Interquartile 75% (IQ3) | 7.5% | 6.4% |
| Interquartile Range (IQR) | 2.3% | 2.3% |
| Standard Deviation (Sample) | 8.0% | 2.2% |
| Standard Deviation (Population) | 7.9% | 2.1% |
Similar Demographics by Female Unemployment
Demographics Similar to Japanese by Female Unemployment
In terms of female unemployment, the demographic groups most similar to Japanese are Immigrants from Western Asia (5.6%, a difference of 0.080%), Guamanian/Chamorro (5.6%, a difference of 0.23%), Cree (5.6%, a difference of 0.24%), Immigrants from Uzbekistan (5.6%, a difference of 0.28%), and Immigrants from Liberia (5.6%, a difference of 0.37%).
| Demographics | Rating | Rank | Female Unemployment |
| Aleuts | 3.0 /100 | #239 | Tragic 5.5% |
| Immigrants | South America | 2.9 /100 | #240 | Tragic 5.5% |
| South American Indians | 2.8 /100 | #241 | Tragic 5.5% |
| Marshallese | 2.3 /100 | #242 | Tragic 5.6% |
| Spanish Americans | 2.2 /100 | #243 | Tragic 5.6% |
| Immigrants | Liberia | 1.5 /100 | #244 | Tragic 5.6% |
| Guamanians/Chamorros | 1.4 /100 | #245 | Tragic 5.6% |
| Japanese | 1.2 /100 | #246 | Tragic 5.6% |
| Immigrants | Western Asia | 1.1 /100 | #247 | Tragic 5.6% |
| Cree | 1.0 /100 | #248 | Tragic 5.6% |
| Immigrants | Uzbekistan | 1.0 /100 | #249 | Tragic 5.6% |
| Immigrants | Syria | 0.8 /100 | #250 | Tragic 5.6% |
| Assyrians/Chaldeans/Syriacs | 0.8 /100 | #251 | Tragic 5.6% |
| Cajuns | 0.7 /100 | #252 | Tragic 5.7% |
| Immigrants | Sierra Leone | 0.6 /100 | #253 | Tragic 5.7% |
Demographics Similar to Bangladeshis by Female Unemployment
In terms of female unemployment, the demographic groups most similar to Bangladeshis are Immigrants from Asia (5.2%, a difference of 0.0%), Syrian (5.2%, a difference of 0.10%), Native Hawaiian (5.2%, a difference of 0.10%), Potawatomi (5.2%, a difference of 0.11%), and Immigrants from Thailand (5.2%, a difference of 0.14%).
| Demographics | Rating | Rank | Female Unemployment |
| Immigrants | Russia | 69.3 /100 | #157 | Good 5.2% |
| Albanians | 68.3 /100 | #158 | Good 5.2% |
| Immigrants | Micronesia | 66.9 /100 | #159 | Good 5.2% |
| Immigrants | Spain | 66.8 /100 | #160 | Good 5.2% |
| Immigrants | Pakistan | 66.7 /100 | #161 | Good 5.2% |
| Potawatomi | 65.9 /100 | #162 | Good 5.2% |
| Immigrants | Asia | 64.3 /100 | #163 | Good 5.2% |
| Bangladeshis | 64.3 /100 | #164 | Good 5.2% |
| Syrians | 62.8 /100 | #165 | Good 5.2% |
| Native Hawaiians | 62.7 /100 | #166 | Good 5.2% |
| Immigrants | Thailand | 62.1 /100 | #167 | Good 5.2% |
| Sri Lankans | 59.4 /100 | #168 | Average 5.2% |
| Immigrants | Chile | 59.0 /100 | #169 | Average 5.2% |
| Spanish | 55.9 /100 | #170 | Average 5.2% |
| Immigrants | Denmark | 55.0 /100 | #171 | Average 5.2% |