Inupiat vs Immigrants from Guyana Unemployment Among Women with Children Ages 6 to 17 years
COMPARE
Inupiat
Immigrants from Guyana
Unemployment Among Women with Children Ages 6 to 17 years
Unemployment Among Women with Children Ages 6 to 17 years Comparison
Inupiat
Immigrants from Guyana
14.9%
UNEMPLOYMENT AMONG WOMEN WITH CHILDREN AGES 6 TO 17 YEARS
0.0/ 100
METRIC RATING
343rd/ 347
METRIC RANK
8.9%
UNEMPLOYMENT AMONG WOMEN WITH CHILDREN AGES 6 TO 17 YEARS
63.0/ 100
METRIC RATING
161st/ 347
METRIC RANK
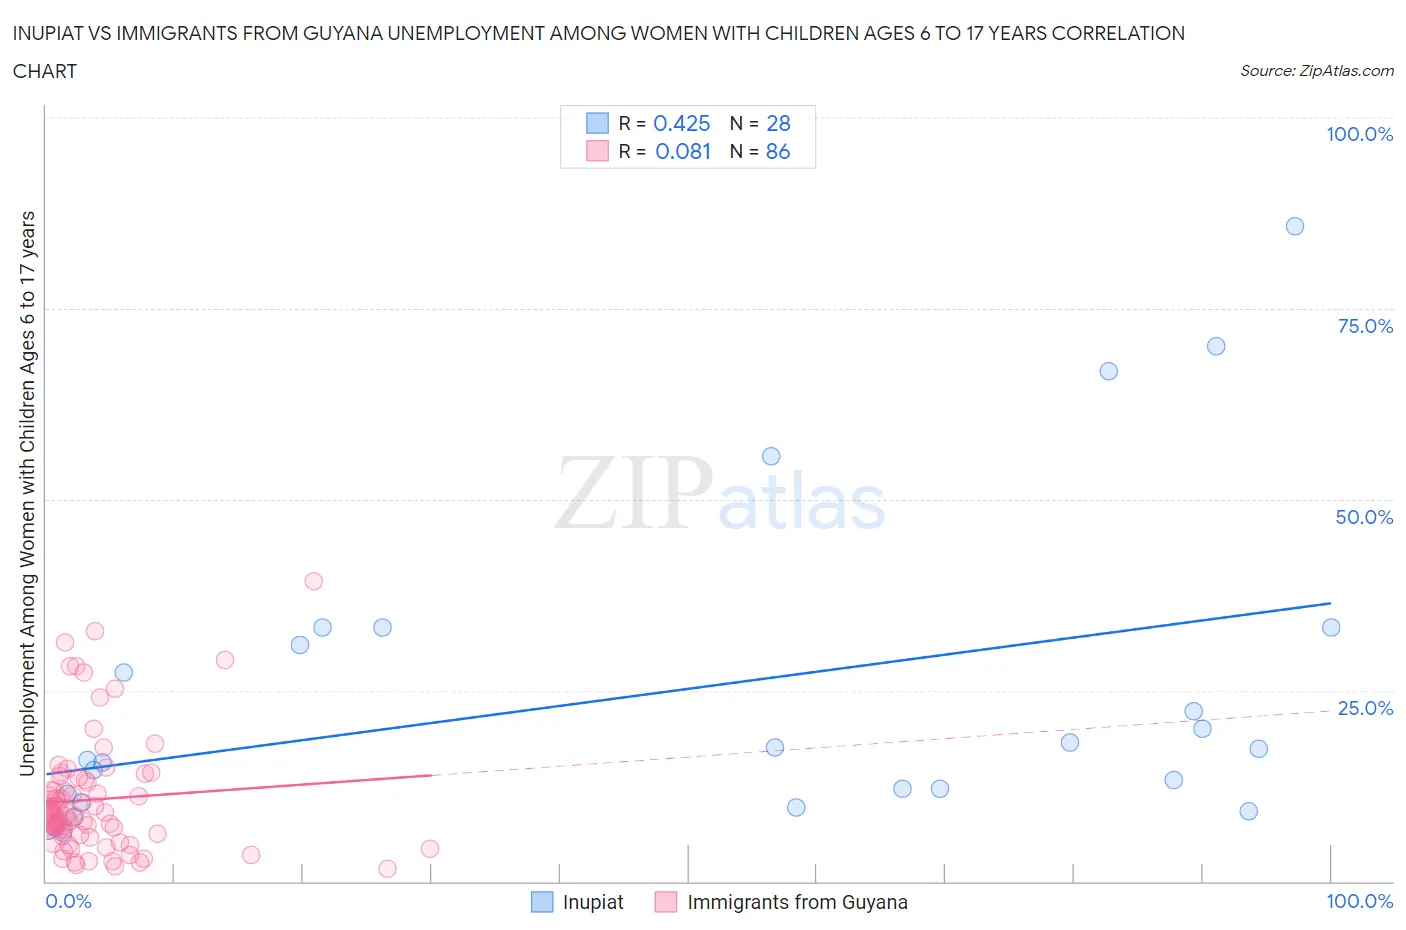
Inupiat vs Immigrants from Guyana Unemployment Among Women with Children Ages 6 to 17 years Correlation Chart
The statistical analysis conducted on geographies consisting of 85,509,455 people shows a moderate positive correlation between the proportion of Inupiat and unemployment rate among women with children between the ages 6 and 17 in the United States with a correlation coefficient (R) of 0.425 and weighted average of 14.9%. Similarly, the statistical analysis conducted on geographies consisting of 149,187,717 people shows a slight positive correlation between the proportion of Immigrants from Guyana and unemployment rate among women with children between the ages 6 and 17 in the United States with a correlation coefficient (R) of 0.081 and weighted average of 8.9%, a difference of 66.7%.
Unemployment Among Women with Children Ages 6 to 17 years Correlation Summary
| Measurement | Inupiat | Immigrants from Guyana |
| Minimum | 6.5% | 1.7% |
| Maximum | 85.7% | 39.3% |
| Range | 79.2% | 37.6% |
| Mean | 24.5% | 10.7% |
| Median | 16.6% | 8.7% |
| Interquartile 25% (IQ1) | 10.8% | 6.0% |
| Interquartile 75% (IQ3) | 32.2% | 12.9% |
| Interquartile Range (IQR) | 21.3% | 6.9% |
| Standard Deviation (Sample) | 20.8% | 7.6% |
| Standard Deviation (Population) | 20.4% | 7.6% |
Similar Demographics by Unemployment Among Women with Children Ages 6 to 17 years
Demographics Similar to Inupiat by Unemployment Among Women with Children Ages 6 to 17 years
In terms of unemployment among women with children ages 6 to 17 years, the demographic groups most similar to Inupiat are Yuman (14.8%, a difference of 0.29%), Navajo (14.2%, a difference of 4.9%), Puerto Rican (13.9%, a difference of 7.1%), Cheyenne (16.4%, a difference of 10.3%), and Sioux (13.2%, a difference of 12.2%).
| Demographics | Rating | Rank | Unemployment Among Women with Children Ages 6 to 17 years |
| Natives/Alaskans | 0.0 /100 | #333 | Tragic 11.5% |
| Ugandans | 0.0 /100 | #334 | Tragic 12.0% |
| Colville | 0.0 /100 | #335 | Tragic 12.3% |
| Houma | 0.0 /100 | #336 | Tragic 12.5% |
| Immigrants | Yemen | 0.0 /100 | #337 | Tragic 12.7% |
| Hopi | 0.0 /100 | #338 | Tragic 12.9% |
| Sioux | 0.0 /100 | #339 | Tragic 13.2% |
| Puerto Ricans | 0.0 /100 | #340 | Tragic 13.9% |
| Navajo | 0.0 /100 | #341 | Tragic 14.2% |
| Yuman | 0.0 /100 | #342 | Tragic 14.8% |
| Inupiat | 0.0 /100 | #343 | Tragic 14.9% |
| Cheyenne | 0.0 /100 | #344 | Tragic 16.4% |
| Arapaho | 0.0 /100 | #345 | Tragic 16.8% |
| Yup'ik | 0.0 /100 | #346 | Tragic 18.6% |
| Pima | 0.0 /100 | #347 | Tragic 18.9% |
Demographics Similar to Immigrants from Guyana by Unemployment Among Women with Children Ages 6 to 17 years
In terms of unemployment among women with children ages 6 to 17 years, the demographic groups most similar to Immigrants from Guyana are Immigrants from Hungary (8.9%, a difference of 0.020%), Spanish (8.9%, a difference of 0.040%), Immigrants from Netherlands (8.9%, a difference of 0.10%), Mexican American Indian (8.9%, a difference of 0.11%), and Immigrants from Chile (8.9%, a difference of 0.12%).
| Demographics | Rating | Rank | Unemployment Among Women with Children Ages 6 to 17 years |
| Vietnamese | 72.1 /100 | #154 | Good 8.9% |
| Immigrants | Greece | 71.8 /100 | #155 | Good 8.9% |
| Osage | 65.9 /100 | #156 | Good 8.9% |
| Immigrants | Belgium | 65.6 /100 | #157 | Good 8.9% |
| Immigrants | Chile | 65.3 /100 | #158 | Good 8.9% |
| Spanish | 63.8 /100 | #159 | Good 8.9% |
| Immigrants | Hungary | 63.4 /100 | #160 | Good 8.9% |
| Immigrants | Guyana | 63.0 /100 | #161 | Good 8.9% |
| Immigrants | Netherlands | 60.8 /100 | #162 | Good 8.9% |
| Mexican American Indians | 60.6 /100 | #163 | Good 8.9% |
| Ukrainians | 59.7 /100 | #164 | Average 8.9% |
| Immigrants | Micronesia | 59.2 /100 | #165 | Average 8.9% |
| Moroccans | 58.3 /100 | #166 | Average 8.9% |
| Immigrants | England | 57.7 /100 | #167 | Average 8.9% |
| Immigrants | Croatia | 57.1 /100 | #168 | Average 8.9% |