Immigrants from Poland vs Immigrants from Guyana Unemployment Among Women with Children Ages 6 to 17 years
COMPARE
Immigrants from Poland
Immigrants from Guyana
Unemployment Among Women with Children Ages 6 to 17 years
Unemployment Among Women with Children Ages 6 to 17 years Comparison
Immigrants from Poland
Immigrants from Guyana
8.8%
UNEMPLOYMENT AMONG WOMEN WITH CHILDREN AGES 6 TO 17 YEARS
88.3/ 100
METRIC RATING
140th/ 347
METRIC RANK
8.9%
UNEMPLOYMENT AMONG WOMEN WITH CHILDREN AGES 6 TO 17 YEARS
63.0/ 100
METRIC RATING
161st/ 347
METRIC RANK
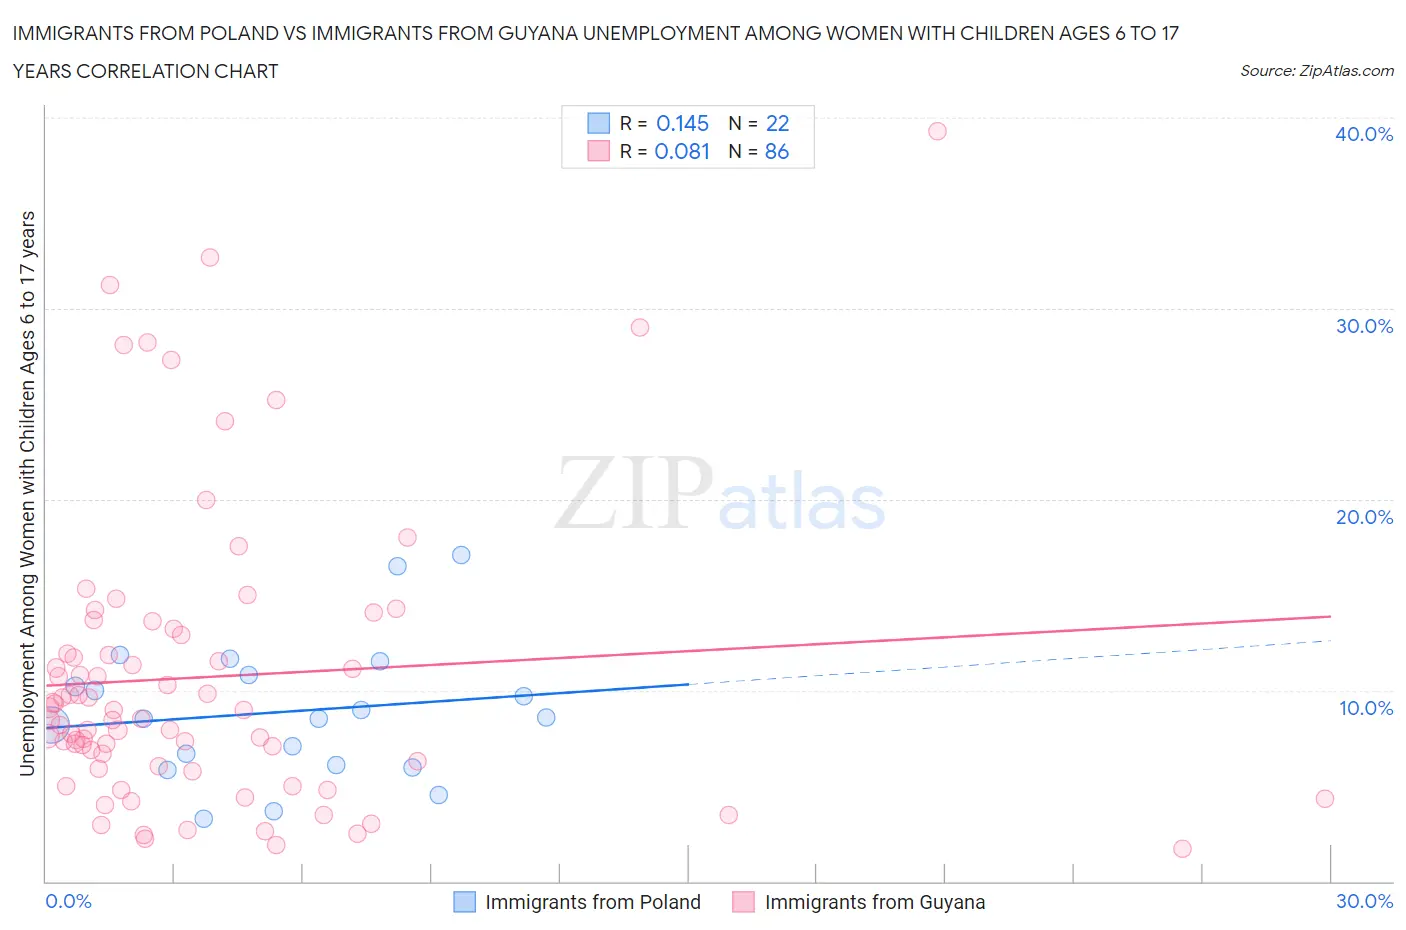
Immigrants from Poland vs Immigrants from Guyana Unemployment Among Women with Children Ages 6 to 17 years Correlation Chart
The statistical analysis conducted on geographies consisting of 224,450,352 people shows a poor positive correlation between the proportion of Immigrants from Poland and unemployment rate among women with children between the ages 6 and 17 in the United States with a correlation coefficient (R) of 0.145 and weighted average of 8.8%. Similarly, the statistical analysis conducted on geographies consisting of 149,187,717 people shows a slight positive correlation between the proportion of Immigrants from Guyana and unemployment rate among women with children between the ages 6 and 17 in the United States with a correlation coefficient (R) of 0.081 and weighted average of 8.9%, a difference of 1.7%.
Unemployment Among Women with Children Ages 6 to 17 years Correlation Summary
| Measurement | Immigrants from Poland | Immigrants from Guyana |
| Minimum | 3.3% | 1.7% |
| Maximum | 17.1% | 39.3% |
| Range | 13.8% | 37.6% |
| Mean | 8.9% | 10.7% |
| Median | 8.5% | 8.7% |
| Interquartile 25% (IQ1) | 6.1% | 6.0% |
| Interquartile 75% (IQ3) | 10.8% | 12.9% |
| Interquartile Range (IQR) | 4.7% | 6.9% |
| Standard Deviation (Sample) | 3.6% | 7.6% |
| Standard Deviation (Population) | 3.5% | 7.6% |
Similar Demographics by Unemployment Among Women with Children Ages 6 to 17 years
Demographics Similar to Immigrants from Poland by Unemployment Among Women with Children Ages 6 to 17 years
In terms of unemployment among women with children ages 6 to 17 years, the demographic groups most similar to Immigrants from Poland are Serbian (8.8%, a difference of 0.070%), Immigrants from Austria (8.8%, a difference of 0.080%), Northern European (8.8%, a difference of 0.11%), Immigrants from Ethiopia (8.8%, a difference of 0.14%), and Immigrants from Argentina (8.7%, a difference of 0.20%).
| Demographics | Rating | Rank | Unemployment Among Women with Children Ages 6 to 17 years |
| Egyptians | 91.8 /100 | #133 | Exceptional 8.7% |
| Immigrants | Ireland | 91.0 /100 | #134 | Exceptional 8.7% |
| Europeans | 90.6 /100 | #135 | Exceptional 8.7% |
| Immigrants | Latvia | 90.4 /100 | #136 | Exceptional 8.7% |
| Immigrants | Argentina | 90.0 /100 | #137 | Excellent 8.7% |
| Immigrants | Ethiopia | 89.5 /100 | #138 | Excellent 8.8% |
| Northern Europeans | 89.2 /100 | #139 | Excellent 8.8% |
| Immigrants | Poland | 88.3 /100 | #140 | Excellent 8.8% |
| Serbians | 87.6 /100 | #141 | Excellent 8.8% |
| Immigrants | Austria | 87.5 /100 | #142 | Excellent 8.8% |
| Immigrants | Kenya | 86.1 /100 | #143 | Excellent 8.8% |
| Russians | 85.8 /100 | #144 | Excellent 8.8% |
| Kenyans | 85.6 /100 | #145 | Excellent 8.8% |
| Chileans | 80.8 /100 | #146 | Excellent 8.8% |
| Immigrants | Bangladesh | 79.4 /100 | #147 | Good 8.8% |
Demographics Similar to Immigrants from Guyana by Unemployment Among Women with Children Ages 6 to 17 years
In terms of unemployment among women with children ages 6 to 17 years, the demographic groups most similar to Immigrants from Guyana are Immigrants from Hungary (8.9%, a difference of 0.020%), Spanish (8.9%, a difference of 0.040%), Immigrants from Netherlands (8.9%, a difference of 0.10%), Mexican American Indian (8.9%, a difference of 0.11%), and Immigrants from Chile (8.9%, a difference of 0.12%).
| Demographics | Rating | Rank | Unemployment Among Women with Children Ages 6 to 17 years |
| Vietnamese | 72.1 /100 | #154 | Good 8.9% |
| Immigrants | Greece | 71.8 /100 | #155 | Good 8.9% |
| Osage | 65.9 /100 | #156 | Good 8.9% |
| Immigrants | Belgium | 65.6 /100 | #157 | Good 8.9% |
| Immigrants | Chile | 65.3 /100 | #158 | Good 8.9% |
| Spanish | 63.8 /100 | #159 | Good 8.9% |
| Immigrants | Hungary | 63.4 /100 | #160 | Good 8.9% |
| Immigrants | Guyana | 63.0 /100 | #161 | Good 8.9% |
| Immigrants | Netherlands | 60.8 /100 | #162 | Good 8.9% |
| Mexican American Indians | 60.6 /100 | #163 | Good 8.9% |
| Ukrainians | 59.7 /100 | #164 | Average 8.9% |
| Immigrants | Micronesia | 59.2 /100 | #165 | Average 8.9% |
| Moroccans | 58.3 /100 | #166 | Average 8.9% |
| Immigrants | England | 57.7 /100 | #167 | Average 8.9% |
| Immigrants | Croatia | 57.1 /100 | #168 | Average 8.9% |