Inupiat vs Hungarian Unemployment Among Women with Children Ages 6 to 17 years
COMPARE
Inupiat
Hungarian
Unemployment Among Women with Children Ages 6 to 17 years
Unemployment Among Women with Children Ages 6 to 17 years Comparison
Inupiat
Hungarians
14.9%
UNEMPLOYMENT AMONG WOMEN WITH CHILDREN AGES 6 TO 17 YEARS
0.0/ 100
METRIC RATING
343rd/ 347
METRIC RANK
9.3%
UNEMPLOYMENT AMONG WOMEN WITH CHILDREN AGES 6 TO 17 YEARS
3.0/ 100
METRIC RATING
236th/ 347
METRIC RANK
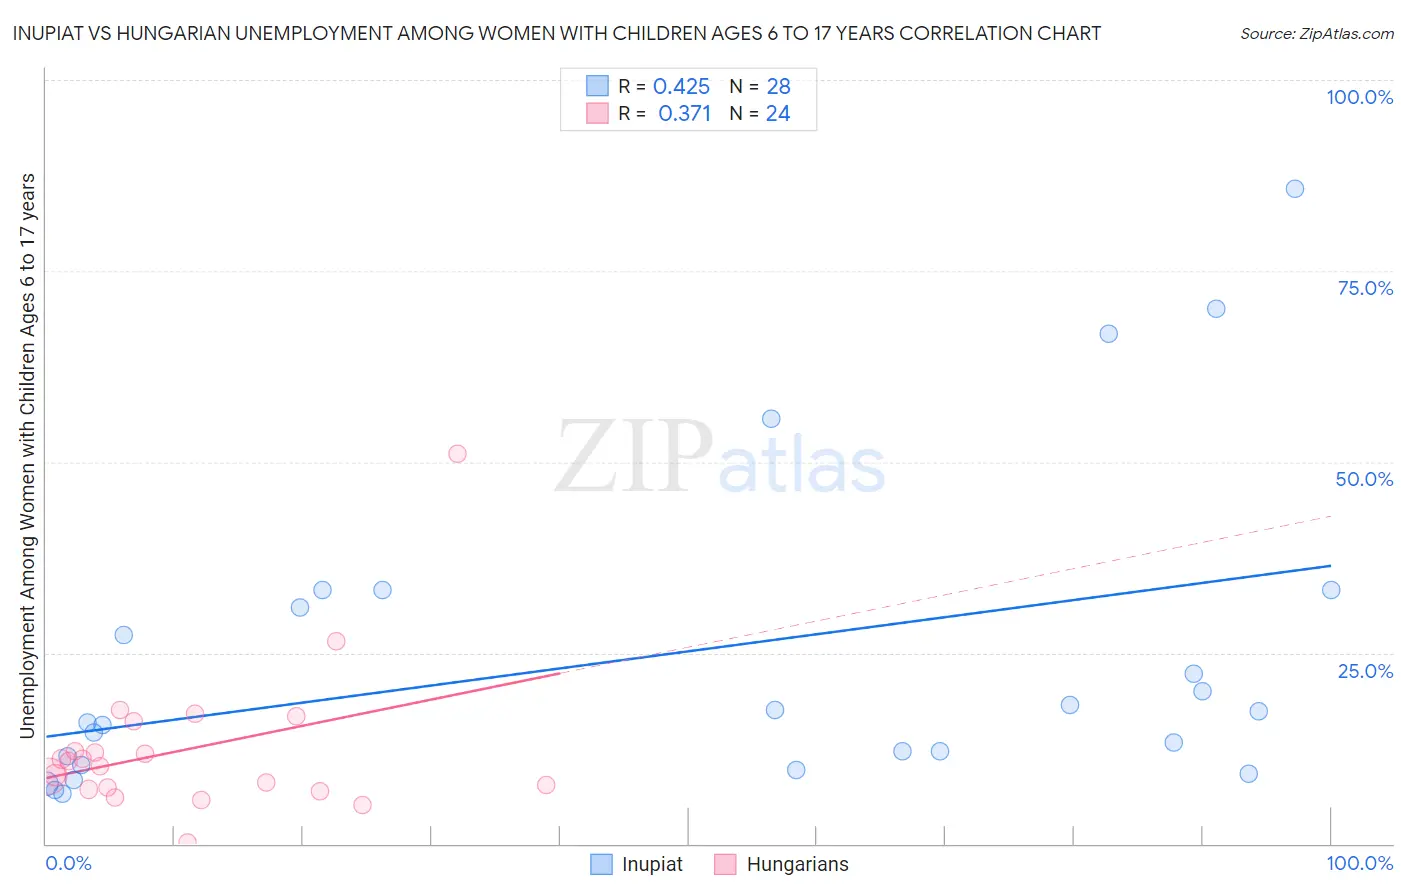
Inupiat vs Hungarian Unemployment Among Women with Children Ages 6 to 17 years Correlation Chart
The statistical analysis conducted on geographies consisting of 85,509,455 people shows a moderate positive correlation between the proportion of Inupiat and unemployment rate among women with children between the ages 6 and 17 in the United States with a correlation coefficient (R) of 0.425 and weighted average of 14.9%. Similarly, the statistical analysis conducted on geographies consisting of 322,463,375 people shows a mild positive correlation between the proportion of Hungarians and unemployment rate among women with children between the ages 6 and 17 in the United States with a correlation coefficient (R) of 0.371 and weighted average of 9.3%, a difference of 59.5%.
Unemployment Among Women with Children Ages 6 to 17 years Correlation Summary
| Measurement | Inupiat | Hungarian |
| Minimum | 6.5% | 0.10% |
| Maximum | 85.7% | 51.0% |
| Range | 79.2% | 50.9% |
| Mean | 24.5% | 12.3% |
| Median | 16.6% | 10.5% |
| Interquartile 25% (IQ1) | 10.8% | 7.3% |
| Interquartile 75% (IQ3) | 32.2% | 14.1% |
| Interquartile Range (IQR) | 21.3% | 6.9% |
| Standard Deviation (Sample) | 20.8% | 9.8% |
| Standard Deviation (Population) | 20.4% | 9.6% |
Similar Demographics by Unemployment Among Women with Children Ages 6 to 17 years
Demographics Similar to Inupiat by Unemployment Among Women with Children Ages 6 to 17 years
In terms of unemployment among women with children ages 6 to 17 years, the demographic groups most similar to Inupiat are Yuman (14.8%, a difference of 0.29%), Navajo (14.2%, a difference of 4.9%), Puerto Rican (13.9%, a difference of 7.1%), Cheyenne (16.4%, a difference of 10.3%), and Sioux (13.2%, a difference of 12.2%).
| Demographics | Rating | Rank | Unemployment Among Women with Children Ages 6 to 17 years |
| Natives/Alaskans | 0.0 /100 | #333 | Tragic 11.5% |
| Ugandans | 0.0 /100 | #334 | Tragic 12.0% |
| Colville | 0.0 /100 | #335 | Tragic 12.3% |
| Houma | 0.0 /100 | #336 | Tragic 12.5% |
| Immigrants | Yemen | 0.0 /100 | #337 | Tragic 12.7% |
| Hopi | 0.0 /100 | #338 | Tragic 12.9% |
| Sioux | 0.0 /100 | #339 | Tragic 13.2% |
| Puerto Ricans | 0.0 /100 | #340 | Tragic 13.9% |
| Navajo | 0.0 /100 | #341 | Tragic 14.2% |
| Yuman | 0.0 /100 | #342 | Tragic 14.8% |
| Inupiat | 0.0 /100 | #343 | Tragic 14.9% |
| Cheyenne | 0.0 /100 | #344 | Tragic 16.4% |
| Arapaho | 0.0 /100 | #345 | Tragic 16.8% |
| Yup'ik | 0.0 /100 | #346 | Tragic 18.6% |
| Pima | 0.0 /100 | #347 | Tragic 18.9% |
Demographics Similar to Hungarians by Unemployment Among Women with Children Ages 6 to 17 years
In terms of unemployment among women with children ages 6 to 17 years, the demographic groups most similar to Hungarians are Uruguayan (9.3%, a difference of 0.030%), Immigrants from Belize (9.3%, a difference of 0.050%), Mexican (9.3%, a difference of 0.090%), Immigrants from St. Vincent and the Grenadines (9.3%, a difference of 0.12%), and Arab (9.3%, a difference of 0.12%).
| Demographics | Rating | Rank | Unemployment Among Women with Children Ages 6 to 17 years |
| Lumbee | 4.3 /100 | #229 | Tragic 9.3% |
| Welsh | 4.0 /100 | #230 | Tragic 9.3% |
| Macedonians | 3.9 /100 | #231 | Tragic 9.3% |
| French American Indians | 3.7 /100 | #232 | Tragic 9.3% |
| Immigrants | St. Vincent and the Grenadines | 3.3 /100 | #233 | Tragic 9.3% |
| Mexicans | 3.2 /100 | #234 | Tragic 9.3% |
| Uruguayans | 3.0 /100 | #235 | Tragic 9.3% |
| Hungarians | 3.0 /100 | #236 | Tragic 9.3% |
| Immigrants | Belize | 2.8 /100 | #237 | Tragic 9.3% |
| Arabs | 2.7 /100 | #238 | Tragic 9.3% |
| Immigrants | Saudi Arabia | 2.7 /100 | #239 | Tragic 9.3% |
| Guatemalans | 2.3 /100 | #240 | Tragic 9.3% |
| Colombians | 2.2 /100 | #241 | Tragic 9.3% |
| Immigrants | Colombia | 2.1 /100 | #242 | Tragic 9.3% |
| Scottish | 2.0 /100 | #243 | Tragic 9.4% |