Inupiat vs Ethiopian Unemployment Among Women with Children Ages 6 to 17 years
COMPARE
Inupiat
Ethiopian
Unemployment Among Women with Children Ages 6 to 17 years
Unemployment Among Women with Children Ages 6 to 17 years Comparison
Inupiat
Ethiopians
14.9%
UNEMPLOYMENT AMONG WOMEN WITH CHILDREN AGES 6 TO 17 YEARS
0.0/ 100
METRIC RATING
343rd/ 347
METRIC RANK
9.0%
UNEMPLOYMENT AMONG WOMEN WITH CHILDREN AGES 6 TO 17 YEARS
37.6/ 100
METRIC RATING
180th/ 347
METRIC RANK
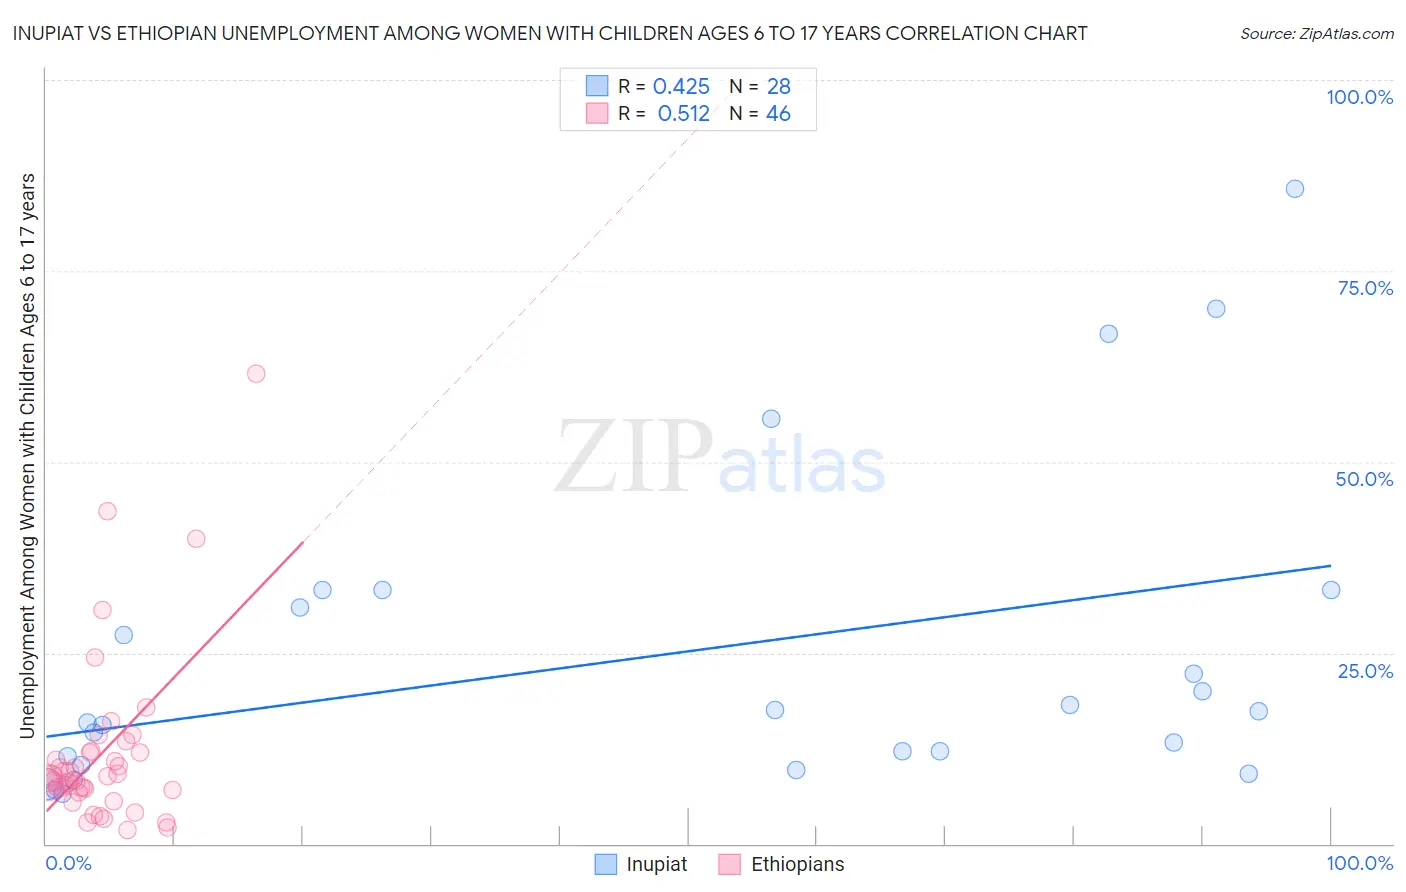
Inupiat vs Ethiopian Unemployment Among Women with Children Ages 6 to 17 years Correlation Chart
The statistical analysis conducted on geographies consisting of 85,509,455 people shows a moderate positive correlation between the proportion of Inupiat and unemployment rate among women with children between the ages 6 and 17 in the United States with a correlation coefficient (R) of 0.425 and weighted average of 14.9%. Similarly, the statistical analysis conducted on geographies consisting of 181,219,006 people shows a substantial positive correlation between the proportion of Ethiopians and unemployment rate among women with children between the ages 6 and 17 in the United States with a correlation coefficient (R) of 0.512 and weighted average of 9.0%, a difference of 64.7%.
Unemployment Among Women with Children Ages 6 to 17 years Correlation Summary
| Measurement | Inupiat | Ethiopian |
| Minimum | 6.5% | 1.8% |
| Maximum | 85.7% | 61.5% |
| Range | 79.2% | 59.7% |
| Mean | 24.5% | 11.8% |
| Median | 16.6% | 8.6% |
| Interquartile 25% (IQ1) | 10.8% | 7.1% |
| Interquartile 75% (IQ3) | 32.2% | 12.0% |
| Interquartile Range (IQR) | 21.3% | 4.9% |
| Standard Deviation (Sample) | 20.8% | 11.4% |
| Standard Deviation (Population) | 20.4% | 11.2% |
Similar Demographics by Unemployment Among Women with Children Ages 6 to 17 years
Demographics Similar to Inupiat by Unemployment Among Women with Children Ages 6 to 17 years
In terms of unemployment among women with children ages 6 to 17 years, the demographic groups most similar to Inupiat are Yuman (14.8%, a difference of 0.29%), Navajo (14.2%, a difference of 4.9%), Puerto Rican (13.9%, a difference of 7.1%), Cheyenne (16.4%, a difference of 10.3%), and Sioux (13.2%, a difference of 12.2%).
| Demographics | Rating | Rank | Unemployment Among Women with Children Ages 6 to 17 years |
| Natives/Alaskans | 0.0 /100 | #333 | Tragic 11.5% |
| Ugandans | 0.0 /100 | #334 | Tragic 12.0% |
| Colville | 0.0 /100 | #335 | Tragic 12.3% |
| Houma | 0.0 /100 | #336 | Tragic 12.5% |
| Immigrants | Yemen | 0.0 /100 | #337 | Tragic 12.7% |
| Hopi | 0.0 /100 | #338 | Tragic 12.9% |
| Sioux | 0.0 /100 | #339 | Tragic 13.2% |
| Puerto Ricans | 0.0 /100 | #340 | Tragic 13.9% |
| Navajo | 0.0 /100 | #341 | Tragic 14.2% |
| Yuman | 0.0 /100 | #342 | Tragic 14.8% |
| Inupiat | 0.0 /100 | #343 | Tragic 14.9% |
| Cheyenne | 0.0 /100 | #344 | Tragic 16.4% |
| Arapaho | 0.0 /100 | #345 | Tragic 16.8% |
| Yup'ik | 0.0 /100 | #346 | Tragic 18.6% |
| Pima | 0.0 /100 | #347 | Tragic 18.9% |
Demographics Similar to Ethiopians by Unemployment Among Women with Children Ages 6 to 17 years
In terms of unemployment among women with children ages 6 to 17 years, the demographic groups most similar to Ethiopians are Immigrants from Zaire (9.0%, a difference of 0.030%), Menominee (9.0%, a difference of 0.080%), Immigrants from Czechoslovakia (9.0%, a difference of 0.15%), South American Indian (9.0%, a difference of 0.16%), and Immigrants from Jordan (9.0%, a difference of 0.18%).
| Demographics | Rating | Rank | Unemployment Among Women with Children Ages 6 to 17 years |
| Immigrants | Brazil | 51.0 /100 | #173 | Average 9.0% |
| Immigrants | Costa Rica | 50.0 /100 | #174 | Average 9.0% |
| Immigrants | Sierra Leone | 45.9 /100 | #175 | Average 9.0% |
| Immigrants | Italy | 43.7 /100 | #176 | Average 9.0% |
| Immigrants | Jordan | 41.6 /100 | #177 | Average 9.0% |
| Menominee | 39.3 /100 | #178 | Fair 9.0% |
| Immigrants | Zaire | 38.3 /100 | #179 | Fair 9.0% |
| Ethiopians | 37.6 /100 | #180 | Fair 9.0% |
| Immigrants | Czechoslovakia | 34.5 /100 | #181 | Fair 9.0% |
| South American Indians | 34.4 /100 | #182 | Fair 9.0% |
| Swiss | 33.5 /100 | #183 | Fair 9.0% |
| Palestinians | 33.4 /100 | #184 | Fair 9.0% |
| Immigrants | Congo | 32.5 /100 | #185 | Fair 9.0% |
| Immigrants | Spain | 32.4 /100 | #186 | Fair 9.0% |
| Comanche | 30.0 /100 | #187 | Fair 9.0% |