Scandinavian vs Immigrants from Guyana Unemployment Among Women with Children Ages 6 to 17 years
COMPARE
Scandinavian
Immigrants from Guyana
Unemployment Among Women with Children Ages 6 to 17 years
Unemployment Among Women with Children Ages 6 to 17 years Comparison
Scandinavians
Immigrants from Guyana
8.6%
UNEMPLOYMENT AMONG WOMEN WITH CHILDREN AGES 6 TO 17 YEARS
98.3/ 100
METRIC RATING
103rd/ 347
METRIC RANK
8.9%
UNEMPLOYMENT AMONG WOMEN WITH CHILDREN AGES 6 TO 17 YEARS
63.0/ 100
METRIC RATING
161st/ 347
METRIC RANK
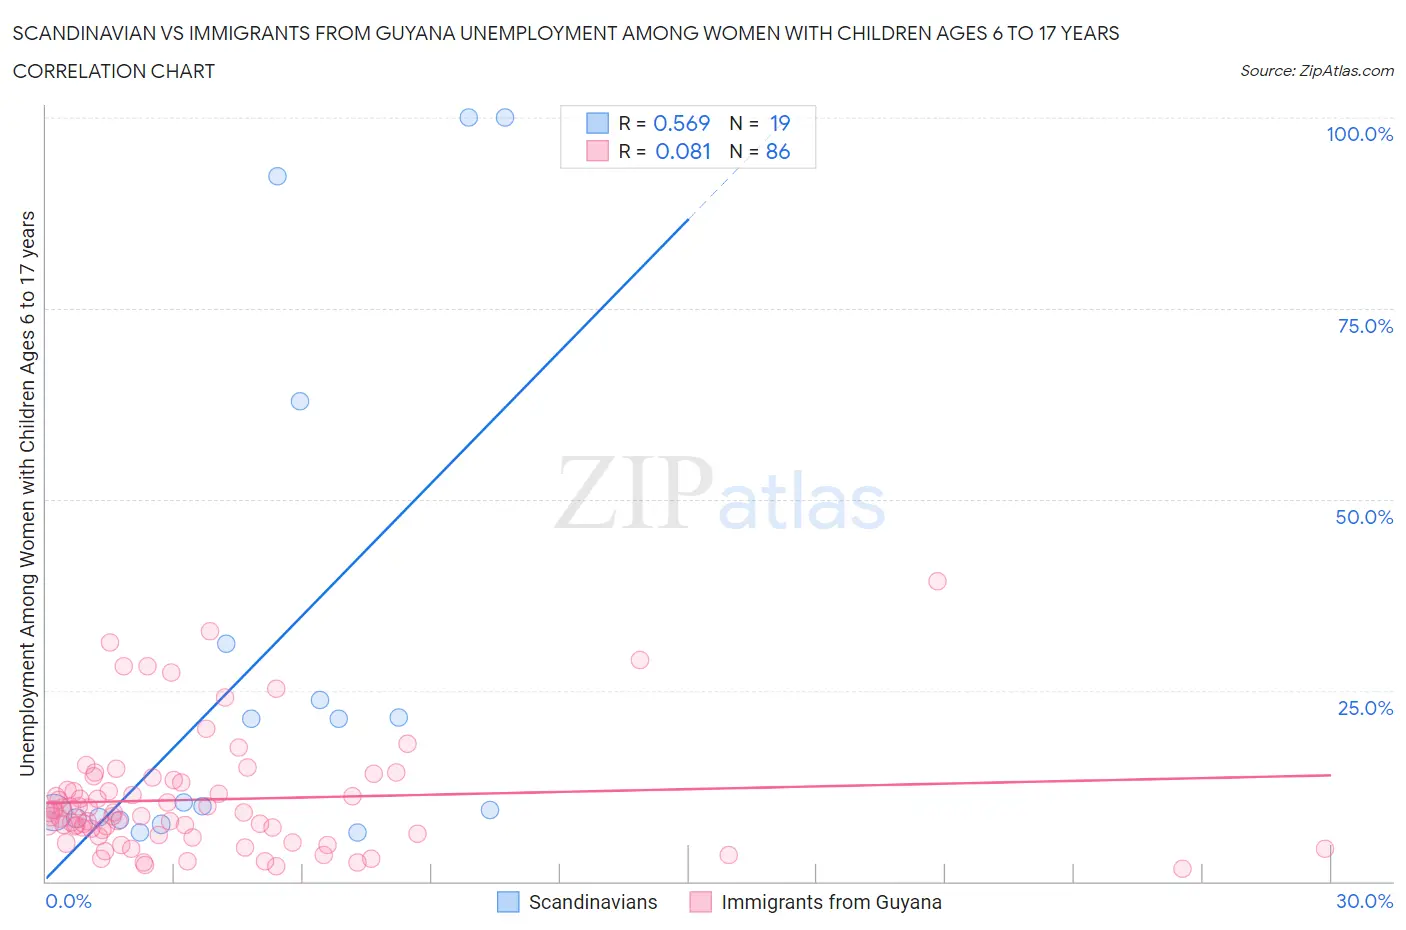
Scandinavian vs Immigrants from Guyana Unemployment Among Women with Children Ages 6 to 17 years Correlation Chart
The statistical analysis conducted on geographies consisting of 313,345,365 people shows a substantial positive correlation between the proportion of Scandinavians and unemployment rate among women with children between the ages 6 and 17 in the United States with a correlation coefficient (R) of 0.569 and weighted average of 8.6%. Similarly, the statistical analysis conducted on geographies consisting of 149,187,717 people shows a slight positive correlation between the proportion of Immigrants from Guyana and unemployment rate among women with children between the ages 6 and 17 in the United States with a correlation coefficient (R) of 0.081 and weighted average of 8.9%, a difference of 4.1%.
Unemployment Among Women with Children Ages 6 to 17 years Correlation Summary
| Measurement | Scandinavian | Immigrants from Guyana |
| Minimum | 6.3% | 1.7% |
| Maximum | 100.0% | 39.3% |
| Range | 93.7% | 37.6% |
| Mean | 29.3% | 10.7% |
| Median | 10.3% | 8.7% |
| Interquartile 25% (IQ1) | 8.3% | 6.0% |
| Interquartile 75% (IQ3) | 31.1% | 12.9% |
| Interquartile Range (IQR) | 22.8% | 6.9% |
| Standard Deviation (Sample) | 33.1% | 7.6% |
| Standard Deviation (Population) | 32.2% | 7.6% |
Similar Demographics by Unemployment Among Women with Children Ages 6 to 17 years
Demographics Similar to Scandinavians by Unemployment Among Women with Children Ages 6 to 17 years
In terms of unemployment among women with children ages 6 to 17 years, the demographic groups most similar to Scandinavians are Immigrants from South Africa (8.6%, a difference of 0.010%), Immigrants from Pakistan (8.6%, a difference of 0.030%), Immigrants from Lithuania (8.6%, a difference of 0.040%), New Zealander (8.6%, a difference of 0.040%), and Malaysian (8.6%, a difference of 0.11%).
| Demographics | Rating | Rank | Unemployment Among Women with Children Ages 6 to 17 years |
| German Russians | 98.6 /100 | #96 | Exceptional 8.5% |
| Bolivians | 98.5 /100 | #97 | Exceptional 8.5% |
| Malaysians | 98.5 /100 | #98 | Exceptional 8.6% |
| Immigrants | Lithuania | 98.4 /100 | #99 | Exceptional 8.6% |
| New Zealanders | 98.4 /100 | #100 | Exceptional 8.6% |
| Immigrants | Pakistan | 98.4 /100 | #101 | Exceptional 8.6% |
| Immigrants | South Africa | 98.3 /100 | #102 | Exceptional 8.6% |
| Scandinavians | 98.3 /100 | #103 | Exceptional 8.6% |
| Immigrants | France | 98.0 /100 | #104 | Exceptional 8.6% |
| Immigrants | Norway | 97.8 /100 | #105 | Exceptional 8.6% |
| Immigrants | Serbia | 97.7 /100 | #106 | Exceptional 8.6% |
| Chickasaw | 97.6 /100 | #107 | Exceptional 8.6% |
| Swedes | 97.6 /100 | #108 | Exceptional 8.6% |
| Immigrants | Romania | 97.5 /100 | #109 | Exceptional 8.6% |
| Latvians | 97.4 /100 | #110 | Exceptional 8.6% |
Demographics Similar to Immigrants from Guyana by Unemployment Among Women with Children Ages 6 to 17 years
In terms of unemployment among women with children ages 6 to 17 years, the demographic groups most similar to Immigrants from Guyana are Immigrants from Hungary (8.9%, a difference of 0.020%), Spanish (8.9%, a difference of 0.040%), Immigrants from Netherlands (8.9%, a difference of 0.10%), Mexican American Indian (8.9%, a difference of 0.11%), and Immigrants from Chile (8.9%, a difference of 0.12%).
| Demographics | Rating | Rank | Unemployment Among Women with Children Ages 6 to 17 years |
| Vietnamese | 72.1 /100 | #154 | Good 8.9% |
| Immigrants | Greece | 71.8 /100 | #155 | Good 8.9% |
| Osage | 65.9 /100 | #156 | Good 8.9% |
| Immigrants | Belgium | 65.6 /100 | #157 | Good 8.9% |
| Immigrants | Chile | 65.3 /100 | #158 | Good 8.9% |
| Spanish | 63.8 /100 | #159 | Good 8.9% |
| Immigrants | Hungary | 63.4 /100 | #160 | Good 8.9% |
| Immigrants | Guyana | 63.0 /100 | #161 | Good 8.9% |
| Immigrants | Netherlands | 60.8 /100 | #162 | Good 8.9% |
| Mexican American Indians | 60.6 /100 | #163 | Good 8.9% |
| Ukrainians | 59.7 /100 | #164 | Average 8.9% |
| Immigrants | Micronesia | 59.2 /100 | #165 | Average 8.9% |
| Moroccans | 58.3 /100 | #166 | Average 8.9% |
| Immigrants | England | 57.7 /100 | #167 | Average 8.9% |
| Immigrants | Croatia | 57.1 /100 | #168 | Average 8.9% |