Indian (Asian) vs South African Female Unemployment

COMPARE

Indian (Asian)
Race
Ancestry
AfghanAfricanAlaska NativeAlaskan AthabascanAlbanianAleutAlsatianAmericanApacheArabArapahoArgentineanArmenianAssyrian/Chaldean/SyriacAustralianAustrianBahamianBangladeshiBarbadianBasqueBelgianBelizeanBermudanBhutaneseBlackfeetBolivianBrazilianBritishBritish West IndianBulgarianBurmeseCajunCambodianCanadianCape VerdeanCarpatho RusynCelticCentral AmericanCentral American IndianCherokeeCheyenneChickasawChileanChineseChippewaChoctawColombianColvilleComancheCosta RicanCreeCreekCroatianCrowCubanCypriotCzechCzechoslovakianDanishDelawareDominicanDutchDutch West IndianEastern EuropeanEcuadorianEgyptianEnglishEstonianEthiopianEuropeanFijianFilipinoFinnishFrenchFrench American IndianFrench CanadianGermanGerman RussianGhanaianGreekGuamanian/ChamorroGuatemalanGuyaneseHaitianHmongHonduranHopiHoumaHungarianIcelanderIndian (Asian)IndonesianInupiatIranianIraqiIrishIroquoisIsraeliItalianJamaicanJapaneseJordanianKenyanKiowaKoreanLaotianLatvianLebaneseLiberianLithuanianLumbeeLuxembourgerMacedonianMalaysianMalteseMarshalleseMenomineeMexicanMexican American IndianMongolianMoroccanNative HawaiianNavajoNepaleseNew ZealanderNicaraguanNigerianNorthern EuropeanNorwegianOkinawanOsageOttawaPaiutePakistaniPalestinianPanamanianParaguayanPennsylvania GermanPeruvianPimaPolishPortuguesePotawatomiPuebloPuerto RicanPuget Sound SalishRomanianRussianSalvadoranSamoanScandinavianScotch-IrishScottishSeminoleSenegaleseSerbianShoshoneSierra LeoneanSiouxSlavicSlovakSloveneSomaliSouth AmericanSouth American IndianSoviet UnionSpaniardSpanishSpanish AmericanSpanish American IndianSri LankanSubsaharan AfricanSudaneseSwedishSwissSyrianTaiwaneseThaiTlingit-HaidaTohono O'OdhamTonganTrinidadian and TobagonianTsimshianTurkishU.S. Virgin IslanderUgandanUkrainianUruguayanUteVenezuelanVietnameseWelshWest IndianYakamaYaquiYugoslavianYumanYup'ikZimbabwean
Immigration
NonimmigrantsImmigrantsAfghanistanAfricaAlbaniaArgentinaArmeniaAsiaAustraliaAustriaBahamasBangladeshBarbadosBelarusBelgiumBelizeBoliviaBosnia and HerzegovinaBrazilBulgariaBurma/MyanmarCabo VerdeCambodiaCameroonCanadaCaribbeanCentral AmericaChileChinaColombiaCongoCosta RicaCroatiaCubaCzechoslovakiaDenmarkDominicaDominican RepublicEastern AfricaEastern AsiaEastern EuropeEcuadorEgyptEl SalvadorEnglandEritreaEthiopiaEuropeFijiFranceGermanyGhanaGreeceGrenadaGuatemalaGuyanaHaitiHondurasHong KongHungaryIndiaIndonesiaIranIraqIrelandIsraelItalyJamaicaJapanJordanKazakhstanKenyaKoreaKuwaitLaosLatin AmericaLatviaLebanonLiberiaLithuaniaMalaysiaMexicoMicronesiaMiddle AfricaMoldovaMoroccoNepalNetherlandsNicaraguaNigeriaNorth AmericaNorth MacedoniaNorthern AfricaNorthern EuropeNorwayOceaniaPakistanPanamaPeruPhilippinesPolandPortugalRomaniaRussiaSaudi ArabiaScotlandSenegalSerbiaSierra LeoneSingaporeSomaliaSouth AfricaSouth AmericaSouth Central AsiaSouth Eastern AsiaSouthern EuropeSpainSri LankaSt. Vincent and the GrenadinesSudanSwedenSwitzerlandSyriaTaiwanThailandTrinidad and TobagoTurkeyUgandaUkraineUruguayUzbekistanVenezuelaVietnamWest IndiesWestern AfricaWestern AsiaWestern EuropeYemenZaireZimbabweAzores
South African
Race
Ancestry
AfghanAfricanAlaska NativeAlaskan AthabascanAlbanianAleutAlsatianAmericanApacheArabArapahoArgentineanArmenianAssyrian/Chaldean/SyriacAustralianAustrianBahamianBangladeshiBarbadianBasqueBelgianBelizeanBermudanBhutaneseBlackfeetBolivianBrazilianBritishBritish West IndianBulgarianBurmeseCajunCambodianCanadianCape VerdeanCarpatho RusynCelticCentral AmericanCentral American IndianCherokeeCheyenneChickasawChileanChineseChippewaChoctawColombianColvilleComancheCosta RicanCreeCreekCroatianCrowCubanCypriotCzechCzechoslovakianDanishDelawareDominicanDutchDutch West IndianEastern EuropeanEcuadorianEgyptianEnglishEstonianEthiopianEuropeanFijianFilipinoFinnishFrenchFrench American IndianFrench CanadianGermanGerman RussianGhanaianGreekGuamanian/ChamorroGuatemalanGuyaneseHaitianHmongHonduranHopiHoumaHungarianIcelanderIndonesianInupiatIranianIraqiIrishIroquoisIsraeliItalianJamaicanJapaneseJordanianKenyanKiowaKoreanLaotianLatvianLebaneseLiberianLithuanianLumbeeLuxembourgerMacedonianMalaysianMalteseMarshalleseMenomineeMexicanMexican American IndianMongolianMoroccanNative HawaiianNavajoNepaleseNew ZealanderNicaraguanNigerianNorthern EuropeanNorwegianOkinawanOsageOttawaPaiutePakistaniPalestinianPanamanianParaguayanPennsylvania GermanPeruvianPimaPolishPortuguesePotawatomiPuebloPuerto RicanPuget Sound SalishRomanianRussianSalvadoranSamoanScandinavianScotch-IrishScottishSeminoleSenegaleseSerbianShoshoneSierra LeoneanSiouxSlavicSlovakSloveneSomaliSouth AfricanSouth AmericanSouth American IndianSoviet UnionSpaniardSpanishSpanish AmericanSpanish American IndianSri LankanSubsaharan AfricanSudaneseSwedishSwissSyrianTaiwaneseThaiTlingit-HaidaTohono O'OdhamTonganTrinidadian and TobagonianTsimshianTurkishU.S. Virgin IslanderUgandanUkrainianUruguayanUteVenezuelanVietnameseWelshWest IndianYakamaYaquiYugoslavianYumanYup'ikZimbabwean
Immigration
NonimmigrantsImmigrantsAfghanistanAfricaAlbaniaArgentinaArmeniaAsiaAustraliaAustriaBahamasBangladeshBarbadosBelarusBelgiumBelizeBoliviaBosnia and HerzegovinaBrazilBulgariaBurma/MyanmarCabo VerdeCambodiaCameroonCanadaCaribbeanCentral AmericaChileChinaColombiaCongoCosta RicaCroatiaCubaCzechoslovakiaDenmarkDominicaDominican RepublicEastern AfricaEastern AsiaEastern EuropeEcuadorEgyptEl SalvadorEnglandEritreaEthiopiaEuropeFijiFranceGermanyGhanaGreeceGrenadaGuatemalaGuyanaHaitiHondurasHong KongHungaryIndiaIndonesiaIranIraqIrelandIsraelItalyJamaicaJapanJordanKazakhstanKenyaKoreaKuwaitLaosLatin AmericaLatviaLebanonLiberiaLithuaniaMalaysiaMexicoMicronesiaMiddle AfricaMoldovaMoroccoNepalNetherlandsNicaraguaNigeriaNorth AmericaNorth MacedoniaNorthern AfricaNorthern EuropeNorwayOceaniaPakistanPanamaPeruPhilippinesPolandPortugalRomaniaRussiaSaudi ArabiaScotlandSenegalSerbiaSierra LeoneSingaporeSomaliaSouth AfricaSouth AmericaSouth Central AsiaSouth Eastern AsiaSouthern EuropeSpainSri LankaSt. Vincent and the GrenadinesSudanSwedenSwitzerlandSyriaTaiwanThailandTrinidad and TobagoTurkeyUgandaUkraineUruguayUzbekistanVenezuelaVietnamWest IndiesWestern AfricaWestern AsiaWestern EuropeYemenZaireZimbabweAzores
Female Unemployment
Income
Poverty
Unemployment
Labor Participation
Family Structure
Vehicle Availability
Education Level
Disability

Female Unemployment Comparison

Indians (Asian)

South Africans

Excellent
Good
5.1%
FEMALE UNEMPLOYMENT
84.2/ 100
METRIC RATING
136th/ 347
METRIC RANK
5.2%
FEMALE UNEMPLOYMENT
70.8/ 100
METRIC RATING
154th/ 347
METRIC RANK

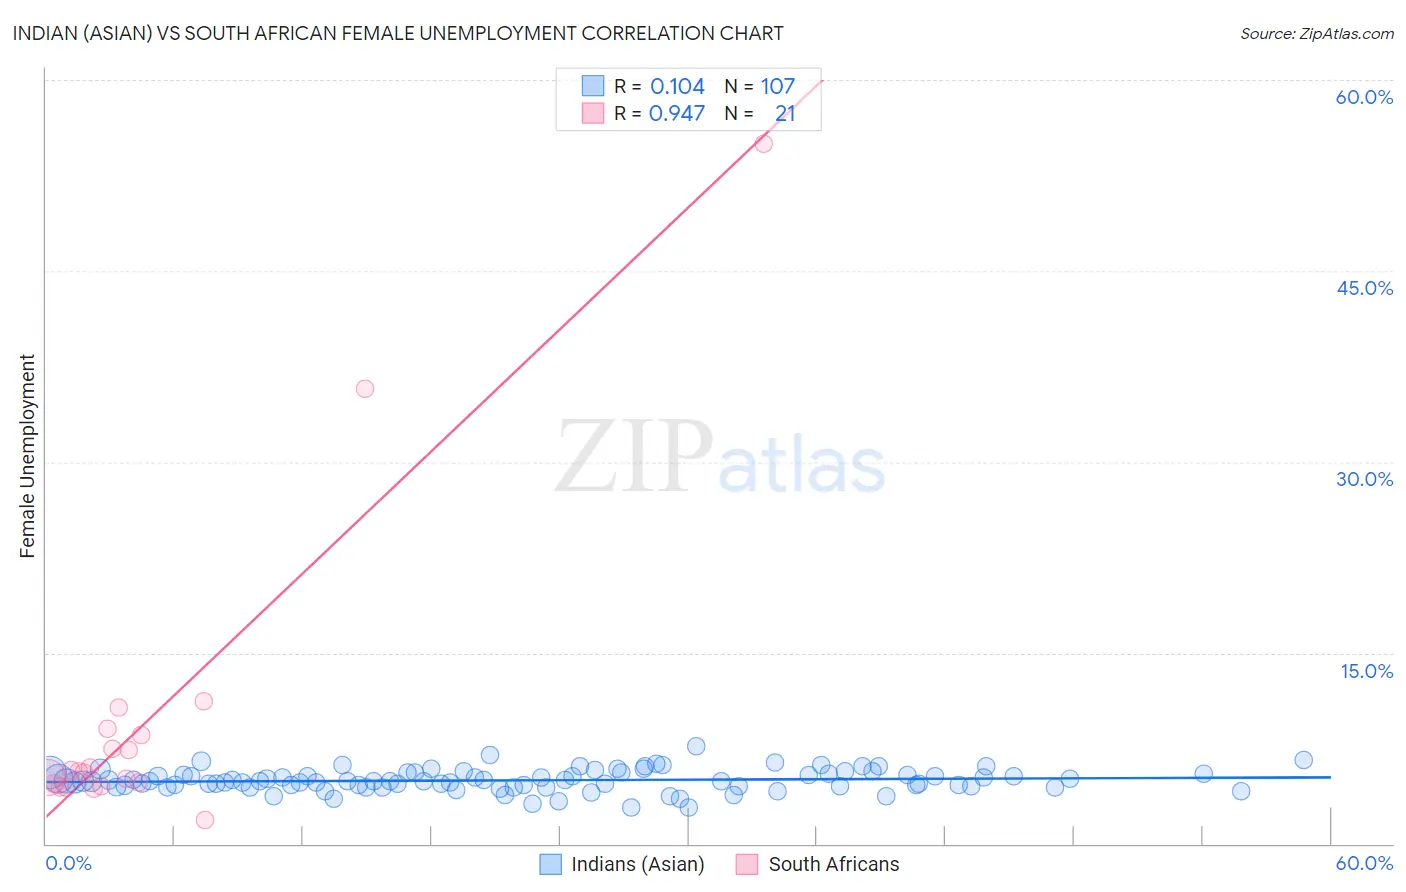
Indian (Asian) vs South African Female Unemployment Correlation Chart

The statistical analysis conducted on geographies consisting of 491,024,006 people shows a poor positive correlation between the proportion of Indians (Asian) and unemploymnet rate among females in the United States with a correlation coefficient (R) of 0.104 and weighted average of 5.1%. Similarly, the statistical analysis conducted on geographies consisting of 182,288,157 people shows a near-perfect positive correlation between the proportion of South Africans and unemploymnet rate among females in the United States with a correlation coefficient (R) of 0.947 and weighted average of 5.2%, a difference of 1.2%.
Indian (Asian) vs South African Female Unemployment

Female Unemployment Correlation Summary

MeasurementIndian (Asian)South African
Minimum2.9%1.9%
Maximum7.6%55.0%
Range4.8%53.1%
Mean5.0%9.9%
Median4.9%5.7%
Interquartile 25% (IQ1)4.5%4.6%
Interquartile 75% (IQ3)5.5%8.8%
Interquartile Range (IQR)0.98%4.2%
Standard Deviation (Sample)0.84%12.4%
Standard Deviation (Population)0.84%12.1%

Demographics Similar to Indians (Asian) and South Africans by Female Unemployment

In terms of female unemployment, the demographic groups most similar to Indians (Asian) are Pakistani (5.1%, a difference of 0.040%), Immigrants from Latvia (5.1%, a difference of 0.050%), Chickasaw (5.1%, a difference of 0.11%), Immigrants from Eastern Asia (5.1%, a difference of 0.13%), and Immigrants from France (5.1%, a difference of 0.17%). Similarly, the demographic groups most similar to South Africans are Immigrants from Egypt (5.2%, a difference of 0.060%), Immigrants from Greece (5.2%, a difference of 0.32%), Immigrants from Italy (5.2%, a difference of 0.33%), Immigrants from China (5.2%, a difference of 0.40%), and Asian (5.2%, a difference of 0.61%).
DemographicsRating | RankFemale Unemployment
Immigrants | Latvia
84.6
/100
|
#135
Excellent
5.1%
Indians (Asian)
84.2
/100
|
#136
Excellent
5.1%
Pakistanis
83.8
/100
|
#137
Excellent
5.1%
Chickasaw
83.2
/100
|
#138
Excellent
5.1%
Immigrants | Eastern Asia
83.0
/100
|
#139
Excellent
5.1%
Immigrants | France
82.7
/100
|
#140
Excellent
5.1%
Immigrants | Eastern Europe
81.5
/100
|
#141
Excellent
5.1%
Palestinians
80.8
/100
|
#142
Excellent
5.1%
Immigrants | Kazakhstan
80.7
/100
|
#143
Excellent
5.1%
Immigrants | Jordan
80.4
/100
|
#144
Excellent
5.1%
Immigrants | Oceania
79.5
/100
|
#145
Good
5.2%
Immigrants | Norway
79.4
/100
|
#146
Good
5.2%
Argentineans
79.2
/100
|
#147
Good
5.2%
Immigrants | Argentina
78.7
/100
|
#148
Good
5.2%
Asians
78.3
/100
|
#149
Good
5.2%
Egyptians
78.3
/100
|
#150
Good
5.2%
Immigrants | China
75.9
/100
|
#151
Good
5.2%
Immigrants | Italy
75.0
/100
|
#152
Good
5.2%
Immigrants | Greece
74.9
/100
|
#153
Good
5.2%
South Africans
70.8
/100
|
#154
Good
5.2%
Immigrants | Egypt
70.0
/100
|
#155
Good
5.2%