Indian (Asian) vs Colville Female Unemployment
COMPARE
Indian (Asian)
Colville
Female Unemployment
Female Unemployment Comparison
Indians (Asian)
Colville
5.1%
FEMALE UNEMPLOYMENT
84.2/ 100
METRIC RATING
136th/ 347
METRIC RANK
6.0%
FEMALE UNEMPLOYMENT
0.0/ 100
METRIC RATING
282nd/ 347
METRIC RANK
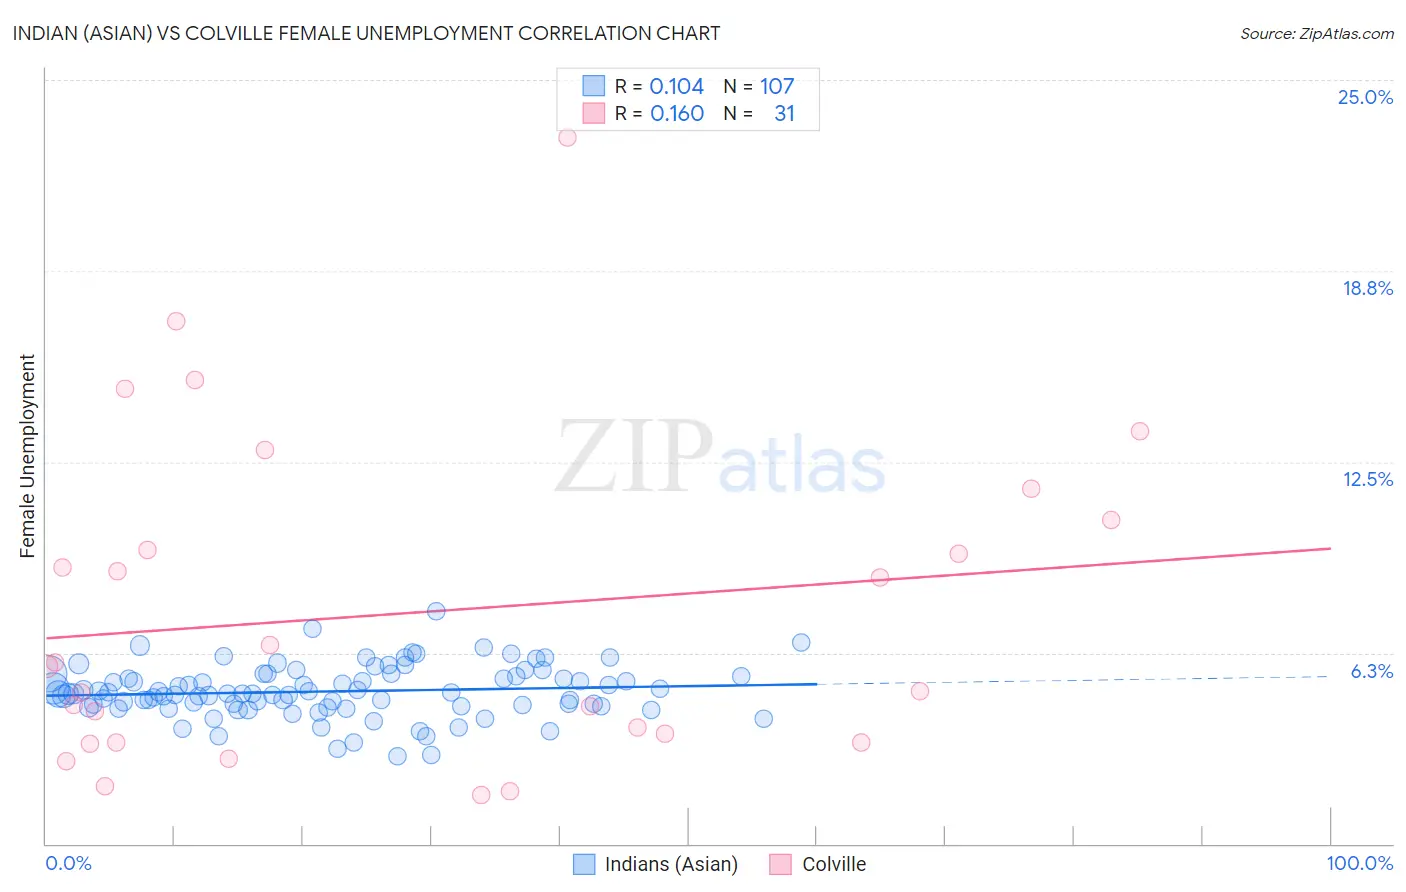
Indian (Asian) vs Colville Female Unemployment Correlation Chart
The statistical analysis conducted on geographies consisting of 491,024,006 people shows a poor positive correlation between the proportion of Indians (Asian) and unemploymnet rate among females in the United States with a correlation coefficient (R) of 0.104 and weighted average of 5.1%. Similarly, the statistical analysis conducted on geographies consisting of 34,651,422 people shows a poor positive correlation between the proportion of Colville and unemploymnet rate among females in the United States with a correlation coefficient (R) of 0.160 and weighted average of 6.0%, a difference of 17.7%.
Female Unemployment Correlation Summary
| Measurement | Indian (Asian) | Colville |
| Minimum | 2.9% | 1.6% |
| Maximum | 7.6% | 23.1% |
| Range | 4.8% | 21.5% |
| Mean | 5.0% | 7.6% |
| Median | 4.9% | 5.8% |
| Interquartile 25% (IQ1) | 4.5% | 3.3% |
| Interquartile 75% (IQ3) | 5.5% | 10.6% |
| Interquartile Range (IQR) | 0.98% | 7.3% |
| Standard Deviation (Sample) | 0.84% | 5.3% |
| Standard Deviation (Population) | 0.84% | 5.2% |
Similar Demographics by Female Unemployment
Demographics Similar to Indians (Asian) by Female Unemployment
In terms of female unemployment, the demographic groups most similar to Indians (Asian) are Pakistani (5.1%, a difference of 0.040%), Immigrants from Eritrea (5.1%, a difference of 0.050%), Immigrants from Latvia (5.1%, a difference of 0.050%), Immigrants from Hong Kong (5.1%, a difference of 0.070%), and Immigrants from Sri Lanka (5.1%, a difference of 0.090%).
| Demographics | Rating | Rank | Female Unemployment |
| Ethiopians | 85.7 /100 | #129 | Excellent 5.1% |
| Maltese | 85.5 /100 | #130 | Excellent 5.1% |
| Immigrants | Ethiopia | 85.4 /100 | #131 | Excellent 5.1% |
| Immigrants | Sri Lanka | 85.0 /100 | #132 | Excellent 5.1% |
| Immigrants | Hong Kong | 84.8 /100 | #133 | Excellent 5.1% |
| Immigrants | Eritrea | 84.6 /100 | #134 | Excellent 5.1% |
| Immigrants | Latvia | 84.6 /100 | #135 | Excellent 5.1% |
| Indians (Asian) | 84.2 /100 | #136 | Excellent 5.1% |
| Pakistanis | 83.8 /100 | #137 | Excellent 5.1% |
| Chickasaw | 83.2 /100 | #138 | Excellent 5.1% |
| Immigrants | Eastern Asia | 83.0 /100 | #139 | Excellent 5.1% |
| Immigrants | France | 82.7 /100 | #140 | Excellent 5.1% |
| Immigrants | Eastern Europe | 81.5 /100 | #141 | Excellent 5.1% |
| Palestinians | 80.8 /100 | #142 | Excellent 5.1% |
| Immigrants | Kazakhstan | 80.7 /100 | #143 | Excellent 5.1% |
Demographics Similar to Colville by Female Unemployment
In terms of female unemployment, the demographic groups most similar to Colville are Salvadoran (6.0%, a difference of 0.10%), Guatemalan (6.0%, a difference of 0.27%), Mexican American Indian (6.0%, a difference of 0.31%), Armenian (6.0%, a difference of 0.37%), and Immigrants from Senegal (6.1%, a difference of 0.44%).
| Demographics | Rating | Rank | Female Unemployment |
| Senegalese | 0.0 /100 | #275 | Tragic 6.0% |
| Bahamians | 0.0 /100 | #276 | Tragic 6.0% |
| Immigrants | Ghana | 0.0 /100 | #277 | Tragic 6.0% |
| Yaqui | 0.0 /100 | #278 | Tragic 6.0% |
| Armenians | 0.0 /100 | #279 | Tragic 6.0% |
| Mexican American Indians | 0.0 /100 | #280 | Tragic 6.0% |
| Guatemalans | 0.0 /100 | #281 | Tragic 6.0% |
| Colville | 0.0 /100 | #282 | Tragic 6.0% |
| Salvadorans | 0.0 /100 | #283 | Tragic 6.0% |
| Immigrants | Senegal | 0.0 /100 | #284 | Tragic 6.1% |
| Immigrants | Cabo Verde | 0.0 /100 | #285 | Tragic 6.1% |
| Chippewa | 0.0 /100 | #286 | Tragic 6.1% |
| Immigrants | Guatemala | 0.0 /100 | #287 | Tragic 6.1% |
| Haitians | 0.0 /100 | #288 | Tragic 6.1% |
| Trinidadians and Tobagonians | 0.0 /100 | #289 | Tragic 6.1% |