Indian (Asian) vs Mexican Female Unemployment
COMPARE
Indian (Asian)
Mexican
Female Unemployment
Female Unemployment Comparison
Indians (Asian)
Mexicans
5.1%
FEMALE UNEMPLOYMENT
84.2/ 100
METRIC RATING
136th/ 347
METRIC RANK
6.1%
FEMALE UNEMPLOYMENT
0.0/ 100
METRIC RATING
293rd/ 347
METRIC RANK
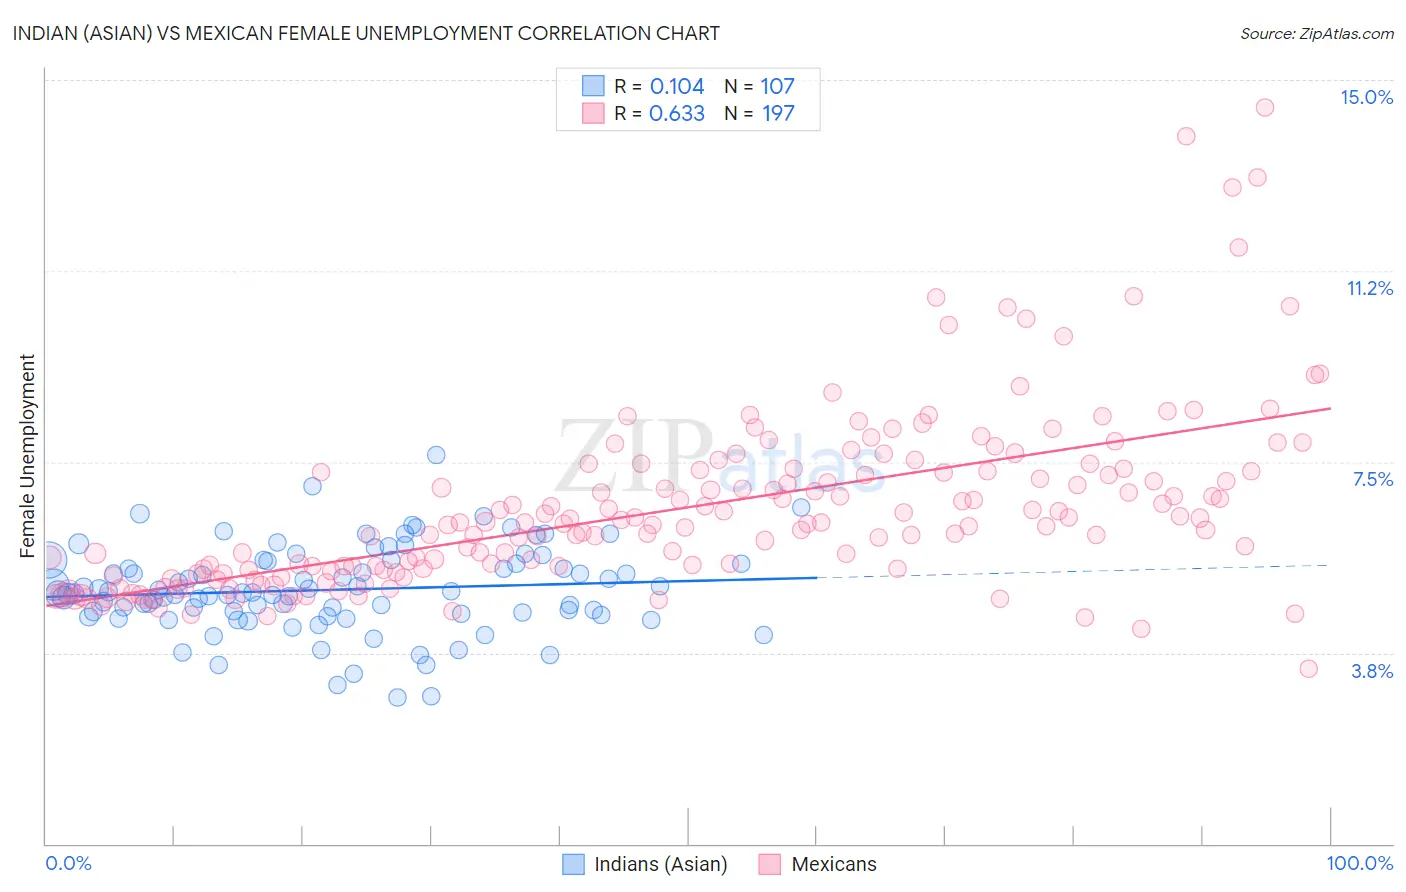
Indian (Asian) vs Mexican Female Unemployment Correlation Chart
The statistical analysis conducted on geographies consisting of 491,024,006 people shows a poor positive correlation between the proportion of Indians (Asian) and unemploymnet rate among females in the United States with a correlation coefficient (R) of 0.104 and weighted average of 5.1%. Similarly, the statistical analysis conducted on geographies consisting of 553,339,596 people shows a significant positive correlation between the proportion of Mexicans and unemploymnet rate among females in the United States with a correlation coefficient (R) of 0.633 and weighted average of 6.1%, a difference of 19.2%.
Female Unemployment Correlation Summary
| Measurement | Indian (Asian) | Mexican |
| Minimum | 2.9% | 3.4% |
| Maximum | 7.6% | 14.5% |
| Range | 4.8% | 11.0% |
| Mean | 5.0% | 6.6% |
| Median | 4.9% | 6.3% |
| Interquartile 25% (IQ1) | 4.5% | 5.4% |
| Interquartile 75% (IQ3) | 5.5% | 7.3% |
| Interquartile Range (IQR) | 0.98% | 1.9% |
| Standard Deviation (Sample) | 0.84% | 1.8% |
| Standard Deviation (Population) | 0.84% | 1.8% |
Similar Demographics by Female Unemployment
Demographics Similar to Indians (Asian) by Female Unemployment
In terms of female unemployment, the demographic groups most similar to Indians (Asian) are Pakistani (5.1%, a difference of 0.040%), Immigrants from Eritrea (5.1%, a difference of 0.050%), Immigrants from Latvia (5.1%, a difference of 0.050%), Immigrants from Hong Kong (5.1%, a difference of 0.070%), and Immigrants from Sri Lanka (5.1%, a difference of 0.090%).
| Demographics | Rating | Rank | Female Unemployment |
| Ethiopians | 85.7 /100 | #129 | Excellent 5.1% |
| Maltese | 85.5 /100 | #130 | Excellent 5.1% |
| Immigrants | Ethiopia | 85.4 /100 | #131 | Excellent 5.1% |
| Immigrants | Sri Lanka | 85.0 /100 | #132 | Excellent 5.1% |
| Immigrants | Hong Kong | 84.8 /100 | #133 | Excellent 5.1% |
| Immigrants | Eritrea | 84.6 /100 | #134 | Excellent 5.1% |
| Immigrants | Latvia | 84.6 /100 | #135 | Excellent 5.1% |
| Indians (Asian) | 84.2 /100 | #136 | Excellent 5.1% |
| Pakistanis | 83.8 /100 | #137 | Excellent 5.1% |
| Chickasaw | 83.2 /100 | #138 | Excellent 5.1% |
| Immigrants | Eastern Asia | 83.0 /100 | #139 | Excellent 5.1% |
| Immigrants | France | 82.7 /100 | #140 | Excellent 5.1% |
| Immigrants | Eastern Europe | 81.5 /100 | #141 | Excellent 5.1% |
| Palestinians | 80.8 /100 | #142 | Excellent 5.1% |
| Immigrants | Kazakhstan | 80.7 /100 | #143 | Excellent 5.1% |
Demographics Similar to Mexicans by Female Unemployment
In terms of female unemployment, the demographic groups most similar to Mexicans are Immigrants from Trinidad and Tobago (6.1%, a difference of 0.080%), Immigrants from El Salvador (6.1%, a difference of 0.10%), Immigrants from West Indies (6.1%, a difference of 0.15%), Immigrants from Latin America (6.1%, a difference of 0.20%), and Alaskan Athabascan (6.1%, a difference of 0.22%).
| Demographics | Rating | Rank | Female Unemployment |
| Chippewa | 0.0 /100 | #286 | Tragic 6.1% |
| Immigrants | Guatemala | 0.0 /100 | #287 | Tragic 6.1% |
| Haitians | 0.0 /100 | #288 | Tragic 6.1% |
| Trinidadians and Tobagonians | 0.0 /100 | #289 | Tragic 6.1% |
| Immigrants | Caribbean | 0.0 /100 | #290 | Tragic 6.1% |
| Immigrants | West Indies | 0.0 /100 | #291 | Tragic 6.1% |
| Immigrants | Trinidad and Tobago | 0.0 /100 | #292 | Tragic 6.1% |
| Mexicans | 0.0 /100 | #293 | Tragic 6.1% |
| Immigrants | El Salvador | 0.0 /100 | #294 | Tragic 6.1% |
| Immigrants | Latin America | 0.0 /100 | #295 | Tragic 6.1% |
| Alaskan Athabascans | 0.0 /100 | #296 | Tragic 6.1% |
| West Indians | 0.0 /100 | #297 | Tragic 6.1% |
| Jamaicans | 0.0 /100 | #298 | Tragic 6.1% |
| Ute | 0.0 /100 | #299 | Tragic 6.1% |
| Immigrants | Haiti | 0.0 /100 | #300 | Tragic 6.1% |