Immigrants from Latvia vs South African Female Unemployment
COMPARE
Immigrants from Latvia
South African
Female Unemployment
Female Unemployment Comparison
Immigrants from Latvia
South Africans
5.1%
FEMALE UNEMPLOYMENT
84.6/ 100
METRIC RATING
135th/ 347
METRIC RANK
5.2%
FEMALE UNEMPLOYMENT
70.8/ 100
METRIC RATING
154th/ 347
METRIC RANK
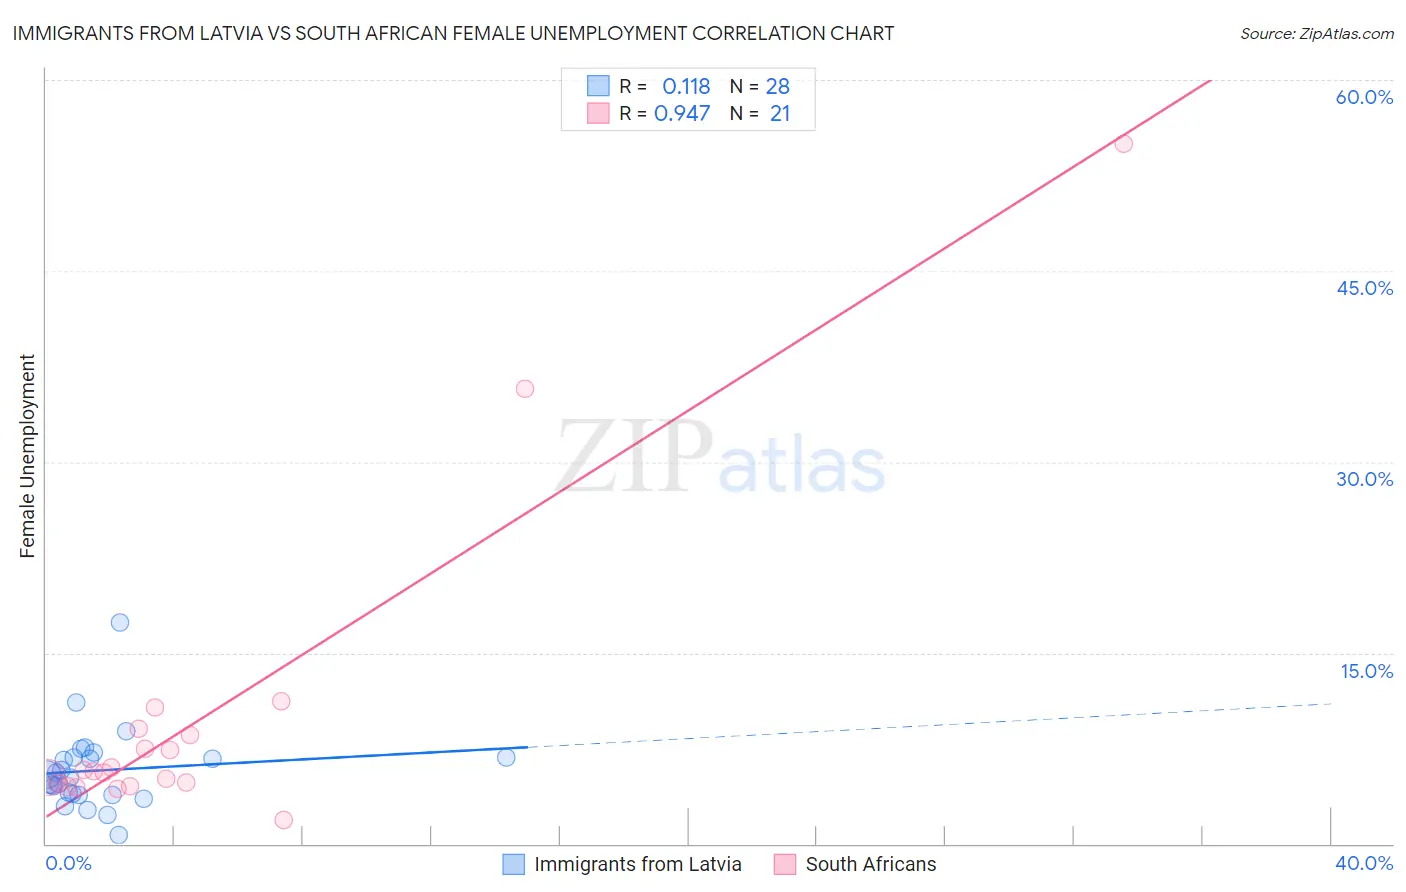
Immigrants from Latvia vs South African Female Unemployment Correlation Chart
The statistical analysis conducted on geographies consisting of 113,613,116 people shows a poor positive correlation between the proportion of Immigrants from Latvia and unemploymnet rate among females in the United States with a correlation coefficient (R) of 0.118 and weighted average of 5.1%. Similarly, the statistical analysis conducted on geographies consisting of 182,288,157 people shows a near-perfect positive correlation between the proportion of South Africans and unemploymnet rate among females in the United States with a correlation coefficient (R) of 0.947 and weighted average of 5.2%, a difference of 1.3%.
Female Unemployment Correlation Summary
| Measurement | Immigrants from Latvia | South African |
| Minimum | 0.70% | 1.9% |
| Maximum | 17.4% | 55.0% |
| Range | 16.7% | 53.1% |
| Mean | 5.8% | 9.9% |
| Median | 5.3% | 5.7% |
| Interquartile 25% (IQ1) | 3.9% | 4.6% |
| Interquartile 75% (IQ3) | 6.8% | 8.8% |
| Interquartile Range (IQR) | 2.9% | 4.2% |
| Standard Deviation (Sample) | 3.1% | 12.4% |
| Standard Deviation (Population) | 3.1% | 12.1% |
Demographics Similar to Immigrants from Latvia and South Africans by Female Unemployment
In terms of female unemployment, the demographic groups most similar to Immigrants from Latvia are Immigrants from Eritrea (5.1%, a difference of 0.0%), Indian (Asian) (5.1%, a difference of 0.050%), Pakistani (5.1%, a difference of 0.090%), Chickasaw (5.1%, a difference of 0.15%), and Immigrants from Eastern Asia (5.1%, a difference of 0.17%). Similarly, the demographic groups most similar to South Africans are Immigrants from Greece (5.2%, a difference of 0.32%), Immigrants from Italy (5.2%, a difference of 0.33%), Immigrants from China (5.2%, a difference of 0.40%), Asian (5.2%, a difference of 0.61%), and Egyptian (5.2%, a difference of 0.61%).
| Demographics | Rating | Rank | Female Unemployment |
| Immigrants | Eritrea | 84.6 /100 | #134 | Excellent 5.1% |
| Immigrants | Latvia | 84.6 /100 | #135 | Excellent 5.1% |
| Indians (Asian) | 84.2 /100 | #136 | Excellent 5.1% |
| Pakistanis | 83.8 /100 | #137 | Excellent 5.1% |
| Chickasaw | 83.2 /100 | #138 | Excellent 5.1% |
| Immigrants | Eastern Asia | 83.0 /100 | #139 | Excellent 5.1% |
| Immigrants | France | 82.7 /100 | #140 | Excellent 5.1% |
| Immigrants | Eastern Europe | 81.5 /100 | #141 | Excellent 5.1% |
| Palestinians | 80.8 /100 | #142 | Excellent 5.1% |
| Immigrants | Kazakhstan | 80.7 /100 | #143 | Excellent 5.1% |
| Immigrants | Jordan | 80.4 /100 | #144 | Excellent 5.1% |
| Immigrants | Oceania | 79.5 /100 | #145 | Good 5.2% |
| Immigrants | Norway | 79.4 /100 | #146 | Good 5.2% |
| Argentineans | 79.2 /100 | #147 | Good 5.2% |
| Immigrants | Argentina | 78.7 /100 | #148 | Good 5.2% |
| Asians | 78.3 /100 | #149 | Good 5.2% |
| Egyptians | 78.3 /100 | #150 | Good 5.2% |
| Immigrants | China | 75.9 /100 | #151 | Good 5.2% |
| Immigrants | Italy | 75.0 /100 | #152 | Good 5.2% |
| Immigrants | Greece | 74.9 /100 | #153 | Good 5.2% |
| South Africans | 70.8 /100 | #154 | Good 5.2% |