Tohono O'odham vs South African Female Unemployment
COMPARE
Tohono O'odham
South African
Female Unemployment
Female Unemployment Comparison
Tohono O'odham
South Africans
7.7%
FEMALE UNEMPLOYMENT
0.0/ 100
METRIC RATING
338th/ 347
METRIC RANK
5.2%
FEMALE UNEMPLOYMENT
70.8/ 100
METRIC RATING
154th/ 347
METRIC RANK
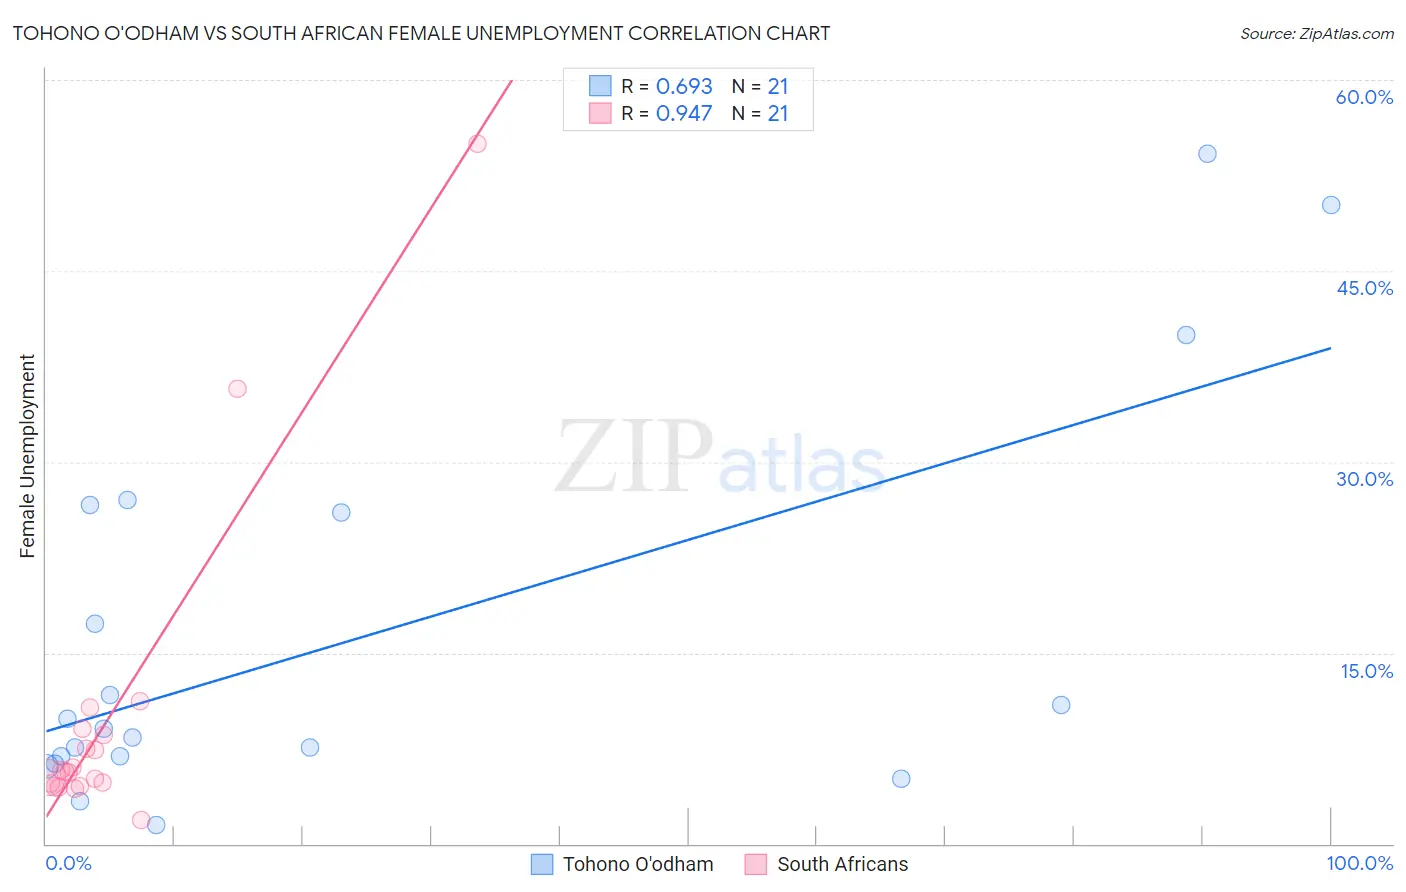
Tohono O'odham vs South African Female Unemployment Correlation Chart
The statistical analysis conducted on geographies consisting of 58,685,659 people shows a significant positive correlation between the proportion of Tohono O'odham and unemploymnet rate among females in the United States with a correlation coefficient (R) of 0.693 and weighted average of 7.7%. Similarly, the statistical analysis conducted on geographies consisting of 182,288,157 people shows a near-perfect positive correlation between the proportion of South Africans and unemploymnet rate among females in the United States with a correlation coefficient (R) of 0.947 and weighted average of 5.2%, a difference of 49.3%.
Female Unemployment Correlation Summary
| Measurement | Tohono O'odham | South African |
| Minimum | 1.5% | 1.9% |
| Maximum | 54.2% | 55.0% |
| Range | 52.7% | 53.1% |
| Mean | 16.3% | 9.9% |
| Median | 9.0% | 5.7% |
| Interquartile 25% (IQ1) | 6.6% | 4.6% |
| Interquartile 75% (IQ3) | 26.3% | 8.8% |
| Interquartile Range (IQR) | 19.8% | 4.2% |
| Standard Deviation (Sample) | 15.4% | 12.4% |
| Standard Deviation (Population) | 15.0% | 12.1% |
Similar Demographics by Female Unemployment
Demographics Similar to Tohono O'odham by Female Unemployment
In terms of female unemployment, the demographic groups most similar to Tohono O'odham are Immigrants from Yemen (7.8%, a difference of 1.2%), Hopi (8.1%, a difference of 4.5%), Inupiat (8.2%, a difference of 5.3%), Navajo (7.3%, a difference of 6.3%), and Immigrants from Dominican Republic (7.2%, a difference of 7.3%).
| Demographics | Rating | Rank | Female Unemployment |
| Paiute | 0.0 /100 | #331 | Tragic 6.8% |
| Sioux | 0.0 /100 | #332 | Tragic 7.0% |
| Menominee | 0.0 /100 | #333 | Tragic 7.0% |
| Immigrants | Armenia | 0.0 /100 | #334 | Tragic 7.1% |
| Dominicans | 0.0 /100 | #335 | Tragic 7.2% |
| Immigrants | Dominican Republic | 0.0 /100 | #336 | Tragic 7.2% |
| Navajo | 0.0 /100 | #337 | Tragic 7.3% |
| Tohono O'odham | 0.0 /100 | #338 | Tragic 7.7% |
| Immigrants | Yemen | 0.0 /100 | #339 | Tragic 7.8% |
| Hopi | 0.0 /100 | #340 | Tragic 8.1% |
| Inupiat | 0.0 /100 | #341 | Tragic 8.2% |
| Puerto Ricans | 0.0 /100 | #342 | Tragic 8.3% |
| Arapaho | 0.0 /100 | #343 | Tragic 8.8% |
| Pima | 0.0 /100 | #344 | Tragic 9.3% |
| Yuman | 0.0 /100 | #345 | Tragic 9.6% |
Demographics Similar to South Africans by Female Unemployment
In terms of female unemployment, the demographic groups most similar to South Africans are Immigrants from Egypt (5.2%, a difference of 0.060%), Immigrants from Northern Africa (5.2%, a difference of 0.080%), Immigrants from Russia (5.2%, a difference of 0.10%), Albanian (5.2%, a difference of 0.18%), and Immigrants from Micronesia (5.2%, a difference of 0.27%).
| Demographics | Rating | Rank | Female Unemployment |
| Argentineans | 79.2 /100 | #147 | Good 5.2% |
| Immigrants | Argentina | 78.7 /100 | #148 | Good 5.2% |
| Asians | 78.3 /100 | #149 | Good 5.2% |
| Egyptians | 78.3 /100 | #150 | Good 5.2% |
| Immigrants | China | 75.9 /100 | #151 | Good 5.2% |
| Immigrants | Italy | 75.0 /100 | #152 | Good 5.2% |
| Immigrants | Greece | 74.9 /100 | #153 | Good 5.2% |
| South Africans | 70.8 /100 | #154 | Good 5.2% |
| Immigrants | Egypt | 70.0 /100 | #155 | Good 5.2% |
| Immigrants | Northern Africa | 69.6 /100 | #156 | Good 5.2% |
| Immigrants | Russia | 69.3 /100 | #157 | Good 5.2% |
| Albanians | 68.3 /100 | #158 | Good 5.2% |
| Immigrants | Micronesia | 66.9 /100 | #159 | Good 5.2% |
| Immigrants | Spain | 66.8 /100 | #160 | Good 5.2% |
| Immigrants | Pakistan | 66.7 /100 | #161 | Good 5.2% |