Immigrants from Zaire vs Immigrants from Hungary Unemployment
COMPARE
Immigrants from Zaire
Immigrants from Hungary
Unemployment
Unemployment Comparison
Immigrants from Zaire
Immigrants from Hungary
5.2%
UNEMPLOYMENT
64.7/ 100
METRIC RATING
163rd/ 347
METRIC RANK
5.1%
UNEMPLOYMENT
85.6/ 100
METRIC RATING
138th/ 347
METRIC RANK
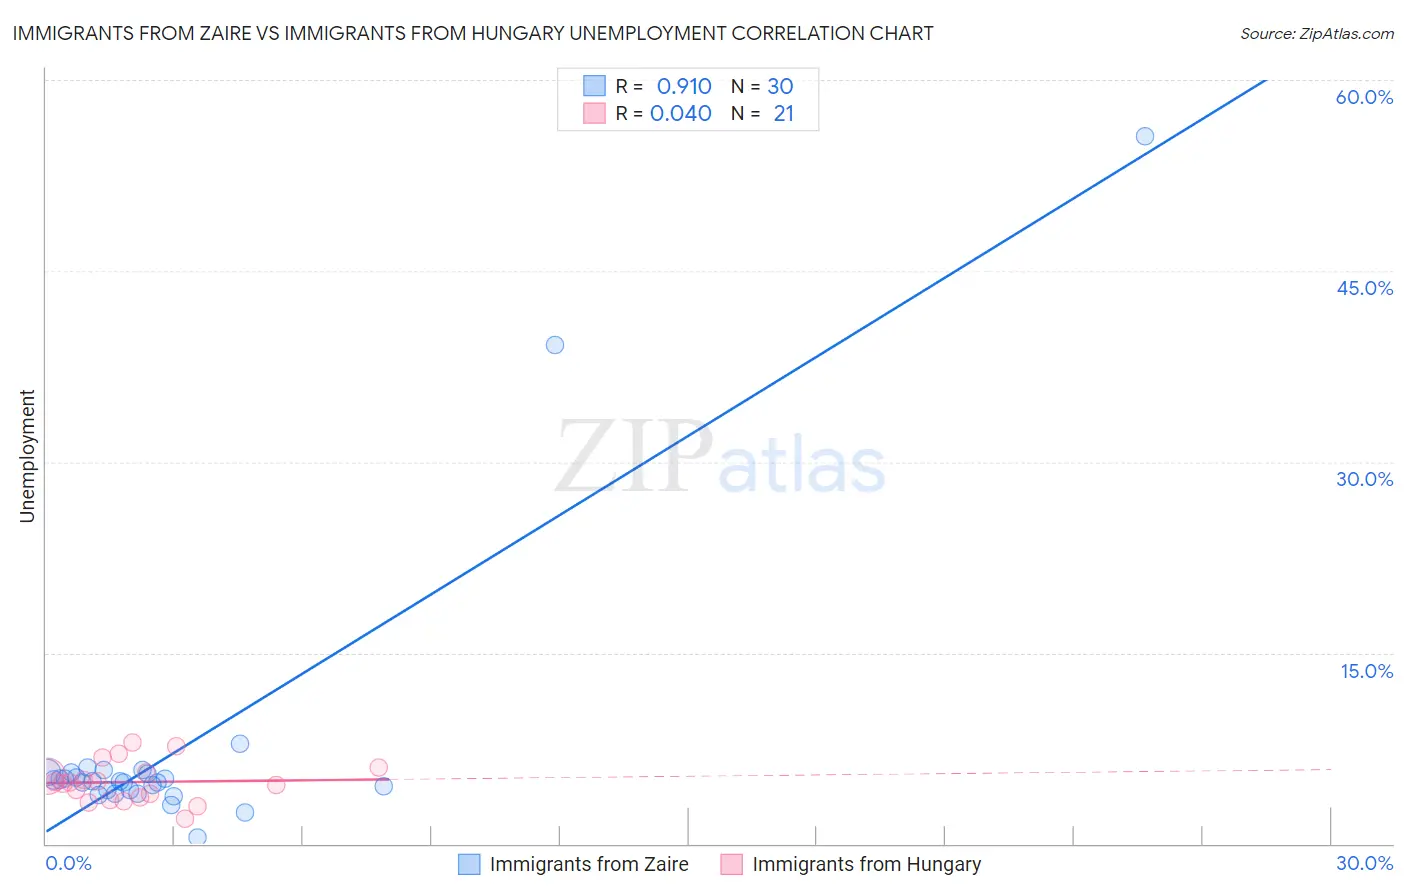
Immigrants from Zaire vs Immigrants from Hungary Unemployment Correlation Chart
The statistical analysis conducted on geographies consisting of 107,241,303 people shows a near-perfect positive correlation between the proportion of Immigrants from Zaire and unemployment in the United States with a correlation coefficient (R) of 0.910 and weighted average of 5.2%. Similarly, the statistical analysis conducted on geographies consisting of 195,624,152 people shows no correlation between the proportion of Immigrants from Hungary and unemployment in the United States with a correlation coefficient (R) of 0.040 and weighted average of 5.1%, a difference of 1.9%.
Unemployment Correlation Summary
| Measurement | Immigrants from Zaire | Immigrants from Hungary |
| Minimum | 0.50% | 2.0% |
| Maximum | 55.6% | 8.0% |
| Range | 55.1% | 6.0% |
| Mean | 7.5% | 4.9% |
| Median | 4.9% | 4.8% |
| Interquartile 25% (IQ1) | 4.2% | 3.5% |
| Interquartile 75% (IQ3) | 5.6% | 5.8% |
| Interquartile Range (IQR) | 1.4% | 2.2% |
| Standard Deviation (Sample) | 11.1% | 1.6% |
| Standard Deviation (Population) | 10.9% | 1.5% |
Similar Demographics by Unemployment
Demographics Similar to Immigrants from Zaire by Unemployment
In terms of unemployment, the demographic groups most similar to Immigrants from Zaire are Immigrants from Colombia (5.2%, a difference of 0.0%), Spanish (5.2%, a difference of 0.020%), Immigrants from Oceania (5.2%, a difference of 0.030%), Laotian (5.2%, a difference of 0.11%), and Immigrants from Brazil (5.2%, a difference of 0.11%).
| Demographics | Rating | Rank | Unemployment |
| Immigrants | Kazakhstan | 70.4 /100 | #156 | Good 5.2% |
| Sri Lankans | 69.5 /100 | #157 | Good 5.2% |
| Immigrants | Egypt | 66.7 /100 | #158 | Good 5.2% |
| Immigrants | Russia | 66.6 /100 | #159 | Good 5.2% |
| Laotians | 66.3 /100 | #160 | Good 5.2% |
| Immigrants | Oceania | 65.2 /100 | #161 | Good 5.2% |
| Spanish | 65.1 /100 | #162 | Good 5.2% |
| Immigrants | Zaire | 64.7 /100 | #163 | Good 5.2% |
| Immigrants | Colombia | 64.7 /100 | #164 | Good 5.2% |
| Immigrants | Brazil | 63.1 /100 | #165 | Good 5.2% |
| Immigrants | Indonesia | 61.2 /100 | #166 | Good 5.2% |
| Colombians | 61.1 /100 | #167 | Good 5.2% |
| Uruguayans | 60.2 /100 | #168 | Good 5.2% |
| Immigrants | Morocco | 59.1 /100 | #169 | Average 5.2% |
| Immigrants | Nicaragua | 57.1 /100 | #170 | Average 5.2% |
Demographics Similar to Immigrants from Hungary by Unemployment
In terms of unemployment, the demographic groups most similar to Immigrants from Hungary are Immigrants from Saudi Arabia (5.1%, a difference of 0.010%), Pakistani (5.1%, a difference of 0.040%), Immigrants from Burma/Myanmar (5.1%, a difference of 0.080%), Immigrants from Spain (5.1%, a difference of 0.080%), and Immigrants from Europe (5.1%, a difference of 0.090%).
| Demographics | Rating | Rank | Unemployment |
| Immigrants | Croatia | 86.8 /100 | #131 | Excellent 5.1% |
| Immigrants | Ethiopia | 86.7 /100 | #132 | Excellent 5.1% |
| Immigrants | Jordan | 86.6 /100 | #133 | Excellent 5.1% |
| Immigrants | Europe | 86.3 /100 | #134 | Excellent 5.1% |
| Immigrants | Burma/Myanmar | 86.2 /100 | #135 | Excellent 5.1% |
| Immigrants | Spain | 86.2 /100 | #136 | Excellent 5.1% |
| Immigrants | Saudi Arabia | 85.6 /100 | #137 | Excellent 5.1% |
| Immigrants | Hungary | 85.6 /100 | #138 | Excellent 5.1% |
| Pakistanis | 85.3 /100 | #139 | Excellent 5.1% |
| Immigrants | Denmark | 84.3 /100 | #140 | Excellent 5.1% |
| Palestinians | 83.4 /100 | #141 | Excellent 5.1% |
| Immigrants | Pakistan | 83.2 /100 | #142 | Excellent 5.1% |
| Immigrants | Chile | 82.8 /100 | #143 | Excellent 5.1% |
| Indonesians | 82.3 /100 | #144 | Excellent 5.1% |
| Immigrants | Norway | 81.8 /100 | #145 | Excellent 5.1% |