Immigrants from Western Africa vs Chippewa Unemployment Among Women with Children Ages 6 to 17 years
COMPARE
Immigrants from Western Africa
Chippewa
Unemployment Among Women with Children Ages 6 to 17 years
Unemployment Among Women with Children Ages 6 to 17 years Comparison
Immigrants from Western Africa
Chippewa
10.1%
UNEMPLOYMENT AMONG WOMEN WITH CHILDREN AGES 6 TO 17 YEARS
0.0/ 100
METRIC RATING
296th/ 347
METRIC RANK
11.1%
UNEMPLOYMENT AMONG WOMEN WITH CHILDREN AGES 6 TO 17 YEARS
0.0/ 100
METRIC RATING
330th/ 347
METRIC RANK
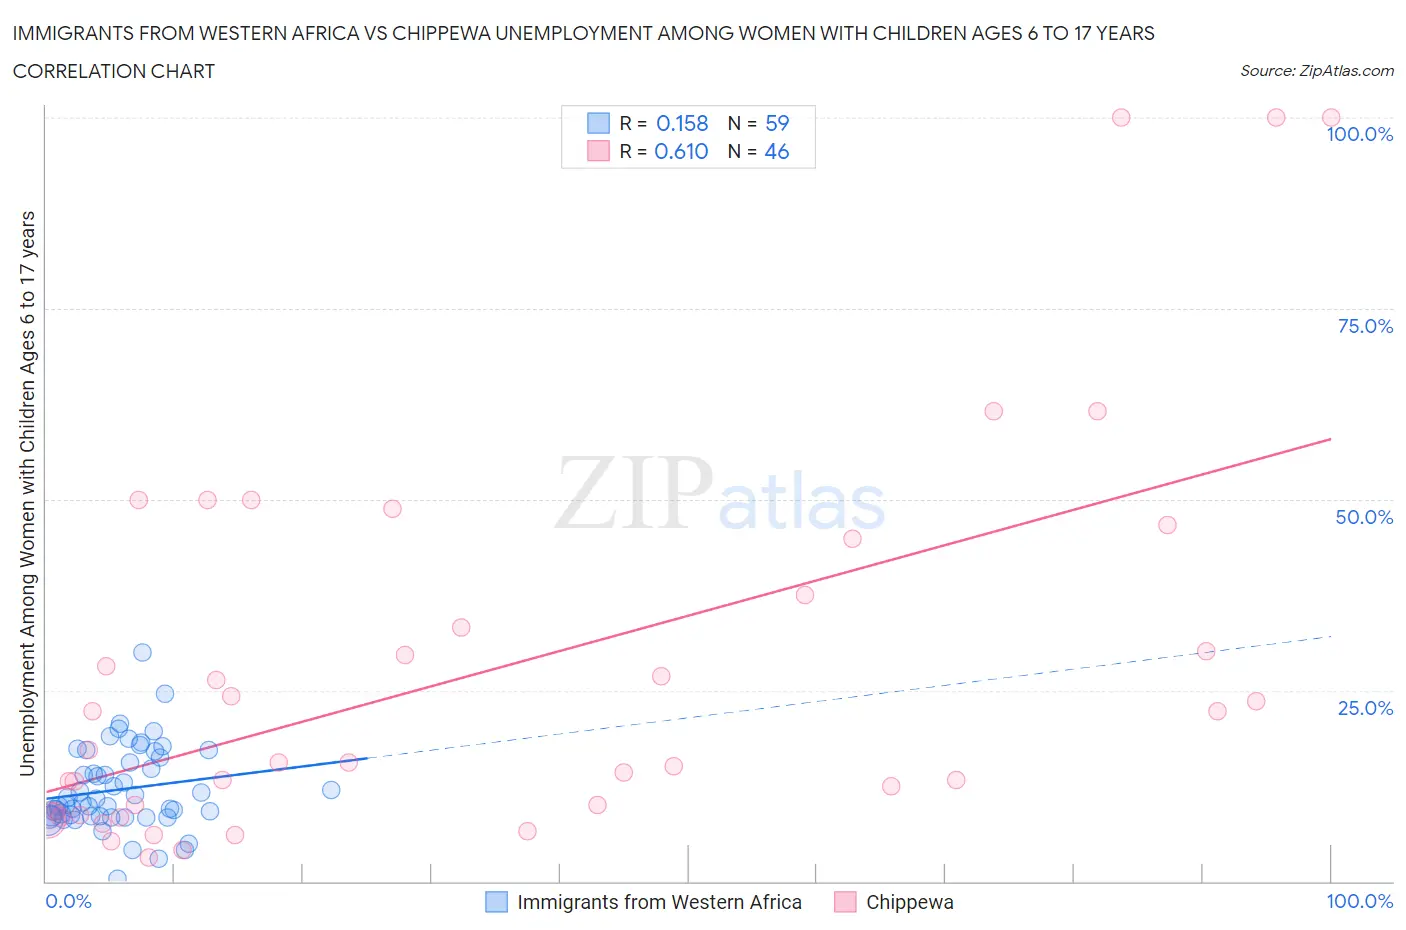
Immigrants from Western Africa vs Chippewa Unemployment Among Women with Children Ages 6 to 17 years Correlation Chart
The statistical analysis conducted on geographies consisting of 270,073,624 people shows a poor positive correlation between the proportion of Immigrants from Western Africa and unemployment rate among women with children between the ages 6 and 17 in the United States with a correlation coefficient (R) of 0.158 and weighted average of 10.1%. Similarly, the statistical analysis conducted on geographies consisting of 165,586,113 people shows a significant positive correlation between the proportion of Chippewa and unemployment rate among women with children between the ages 6 and 17 in the United States with a correlation coefficient (R) of 0.610 and weighted average of 11.1%, a difference of 10.2%.
Unemployment Among Women with Children Ages 6 to 17 years Correlation Summary
| Measurement | Immigrants from Western Africa | Chippewa |
| Minimum | 0.30% | 3.1% |
| Maximum | 30.0% | 100.0% |
| Range | 29.7% | 96.9% |
| Mean | 12.0% | 27.4% |
| Median | 10.3% | 16.4% |
| Interquartile 25% (IQ1) | 8.5% | 9.2% |
| Interquartile 75% (IQ3) | 16.2% | 37.5% |
| Interquartile Range (IQR) | 7.7% | 28.3% |
| Standard Deviation (Sample) | 5.4% | 25.2% |
| Standard Deviation (Population) | 5.4% | 24.9% |
Similar Demographics by Unemployment Among Women with Children Ages 6 to 17 years
Demographics Similar to Immigrants from Western Africa by Unemployment Among Women with Children Ages 6 to 17 years
In terms of unemployment among women with children ages 6 to 17 years, the demographic groups most similar to Immigrants from Western Africa are Immigrants from Caribbean (10.1%, a difference of 0.020%), Immigrants from Haiti (10.1%, a difference of 0.32%), Cherokee (10.0%, a difference of 0.34%), Immigrants from Honduras (10.1%, a difference of 0.34%), and Nigerian (10.1%, a difference of 0.36%).
| Demographics | Rating | Rank | Unemployment Among Women with Children Ages 6 to 17 years |
| Hondurans | 0.0 /100 | #289 | Tragic 10.0% |
| Sub-Saharan Africans | 0.0 /100 | #290 | Tragic 10.0% |
| Immigrants | Nonimmigrants | 0.0 /100 | #291 | Tragic 10.0% |
| Carpatho Rusyns | 0.0 /100 | #292 | Tragic 10.0% |
| Haitians | 0.0 /100 | #293 | Tragic 10.0% |
| Ecuadorians | 0.0 /100 | #294 | Tragic 10.0% |
| Cherokee | 0.0 /100 | #295 | Tragic 10.0% |
| Immigrants | Western Africa | 0.0 /100 | #296 | Tragic 10.1% |
| Immigrants | Caribbean | 0.0 /100 | #297 | Tragic 10.1% |
| Immigrants | Haiti | 0.0 /100 | #298 | Tragic 10.1% |
| Immigrants | Honduras | 0.0 /100 | #299 | Tragic 10.1% |
| Nigerians | 0.0 /100 | #300 | Tragic 10.1% |
| Immigrants | Bahamas | 0.0 /100 | #301 | Tragic 10.1% |
| Venezuelans | 0.0 /100 | #302 | Tragic 10.2% |
| Immigrants | Ecuador | 0.0 /100 | #303 | Tragic 10.2% |
Demographics Similar to Chippewa by Unemployment Among Women with Children Ages 6 to 17 years
In terms of unemployment among women with children ages 6 to 17 years, the demographic groups most similar to Chippewa are Pennsylvania German (11.0%, a difference of 0.48%), Ottawa (10.9%, a difference of 2.0%), Cape Verdean (10.9%, a difference of 2.1%), Liberian (10.8%, a difference of 2.2%), and Cajun (10.8%, a difference of 2.2%).
| Demographics | Rating | Rank | Unemployment Among Women with Children Ages 6 to 17 years |
| Dominicans | 0.0 /100 | #323 | Tragic 10.8% |
| Immigrants | Dominican Republic | 0.0 /100 | #324 | Tragic 10.8% |
| Cajuns | 0.0 /100 | #325 | Tragic 10.8% |
| Liberians | 0.0 /100 | #326 | Tragic 10.8% |
| Cape Verdeans | 0.0 /100 | #327 | Tragic 10.9% |
| Ottawa | 0.0 /100 | #328 | Tragic 10.9% |
| Pennsylvania Germans | 0.0 /100 | #329 | Tragic 11.0% |
| Chippewa | 0.0 /100 | #330 | Tragic 11.1% |
| Blacks/African Americans | 0.0 /100 | #331 | Tragic 11.4% |
| Tsimshian | 0.0 /100 | #332 | Tragic 11.4% |
| Natives/Alaskans | 0.0 /100 | #333 | Tragic 11.5% |
| Ugandans | 0.0 /100 | #334 | Tragic 12.0% |
| Colville | 0.0 /100 | #335 | Tragic 12.3% |
| Houma | 0.0 /100 | #336 | Tragic 12.5% |
| Immigrants | Yemen | 0.0 /100 | #337 | Tragic 12.7% |