Immigrants from Western Africa vs Immigrants from Nigeria Unemployment Among Women with Children Ages 6 to 17 years
COMPARE
Immigrants from Western Africa
Immigrants from Nigeria
Unemployment Among Women with Children Ages 6 to 17 years
Unemployment Among Women with Children Ages 6 to 17 years Comparison
Immigrants from Western Africa
Immigrants from Nigeria
10.1%
UNEMPLOYMENT AMONG WOMEN WITH CHILDREN AGES 6 TO 17 YEARS
0.0/ 100
METRIC RATING
296th/ 347
METRIC RANK
10.2%
UNEMPLOYMENT AMONG WOMEN WITH CHILDREN AGES 6 TO 17 YEARS
0.0/ 100
METRIC RATING
305th/ 347
METRIC RANK
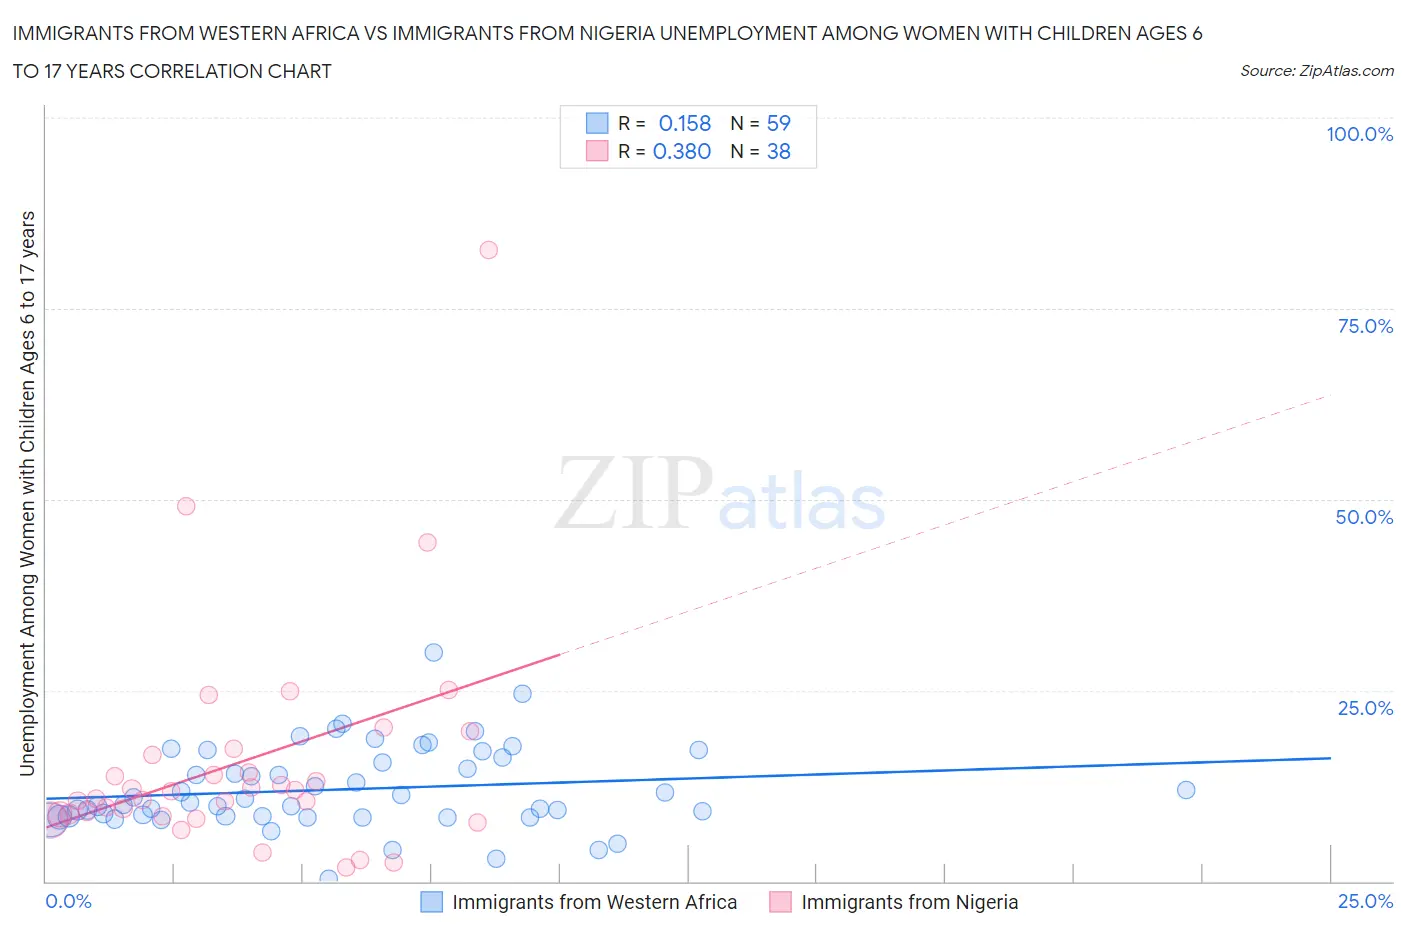
Immigrants from Western Africa vs Immigrants from Nigeria Unemployment Among Women with Children Ages 6 to 17 years Correlation Chart
The statistical analysis conducted on geographies consisting of 270,073,624 people shows a poor positive correlation between the proportion of Immigrants from Western Africa and unemployment rate among women with children between the ages 6 and 17 in the United States with a correlation coefficient (R) of 0.158 and weighted average of 10.1%. Similarly, the statistical analysis conducted on geographies consisting of 224,793,064 people shows a mild positive correlation between the proportion of Immigrants from Nigeria and unemployment rate among women with children between the ages 6 and 17 in the United States with a correlation coefficient (R) of 0.380 and weighted average of 10.2%, a difference of 1.3%.
Unemployment Among Women with Children Ages 6 to 17 years Correlation Summary
| Measurement | Immigrants from Western Africa | Immigrants from Nigeria |
| Minimum | 0.30% | 1.8% |
| Maximum | 30.0% | 82.6% |
| Range | 29.7% | 80.8% |
| Mean | 12.0% | 15.5% |
| Median | 10.3% | 11.3% |
| Interquartile 25% (IQ1) | 8.5% | 8.8% |
| Interquartile 75% (IQ3) | 16.2% | 16.5% |
| Interquartile Range (IQR) | 7.7% | 7.7% |
| Standard Deviation (Sample) | 5.4% | 14.8% |
| Standard Deviation (Population) | 5.4% | 14.6% |
Demographics Similar to Immigrants from Western Africa and Immigrants from Nigeria by Unemployment Among Women with Children Ages 6 to 17 years
In terms of unemployment among women with children ages 6 to 17 years, the demographic groups most similar to Immigrants from Western Africa are Immigrants from Caribbean (10.1%, a difference of 0.020%), Immigrants from Haiti (10.1%, a difference of 0.32%), Cherokee (10.0%, a difference of 0.34%), Immigrants from Honduras (10.1%, a difference of 0.34%), and Nigerian (10.1%, a difference of 0.36%). Similarly, the demographic groups most similar to Immigrants from Nigeria are Immigrants from Venezuela (10.2%, a difference of 0.060%), Immigrants from Ecuador (10.2%, a difference of 0.15%), Paraguayan (10.2%, a difference of 0.29%), Venezuelan (10.2%, a difference of 0.32%), and Immigrants from Senegal (10.2%, a difference of 0.52%).
| Demographics | Rating | Rank | Unemployment Among Women with Children Ages 6 to 17 years |
| Sub-Saharan Africans | 0.0 /100 | #290 | Tragic 10.0% |
| Immigrants | Nonimmigrants | 0.0 /100 | #291 | Tragic 10.0% |
| Carpatho Rusyns | 0.0 /100 | #292 | Tragic 10.0% |
| Haitians | 0.0 /100 | #293 | Tragic 10.0% |
| Ecuadorians | 0.0 /100 | #294 | Tragic 10.0% |
| Cherokee | 0.0 /100 | #295 | Tragic 10.0% |
| Immigrants | Western Africa | 0.0 /100 | #296 | Tragic 10.1% |
| Immigrants | Caribbean | 0.0 /100 | #297 | Tragic 10.1% |
| Immigrants | Haiti | 0.0 /100 | #298 | Tragic 10.1% |
| Immigrants | Honduras | 0.0 /100 | #299 | Tragic 10.1% |
| Nigerians | 0.0 /100 | #300 | Tragic 10.1% |
| Immigrants | Bahamas | 0.0 /100 | #301 | Tragic 10.1% |
| Venezuelans | 0.0 /100 | #302 | Tragic 10.2% |
| Immigrants | Ecuador | 0.0 /100 | #303 | Tragic 10.2% |
| Immigrants | Venezuela | 0.0 /100 | #304 | Tragic 10.2% |
| Immigrants | Nigeria | 0.0 /100 | #305 | Tragic 10.2% |
| Paraguayans | 0.0 /100 | #306 | Tragic 10.2% |
| Immigrants | Senegal | 0.0 /100 | #307 | Tragic 10.2% |
| Dutch West Indians | 0.0 /100 | #308 | Tragic 10.2% |
| French Canadians | 0.0 /100 | #309 | Tragic 10.3% |
| Alaska Natives | 0.0 /100 | #310 | Tragic 10.3% |