Immigrants from Western Africa vs British West Indian Unemployment Among Women with Children Ages 6 to 17 years
COMPARE
Immigrants from Western Africa
British West Indian
Unemployment Among Women with Children Ages 6 to 17 years
Unemployment Among Women with Children Ages 6 to 17 years Comparison
Immigrants from Western Africa
British West Indians
10.1%
UNEMPLOYMENT AMONG WOMEN WITH CHILDREN AGES 6 TO 17 YEARS
0.0/ 100
METRIC RATING
296th/ 347
METRIC RANK
9.7%
UNEMPLOYMENT AMONG WOMEN WITH CHILDREN AGES 6 TO 17 YEARS
0.1/ 100
METRIC RATING
277th/ 347
METRIC RANK
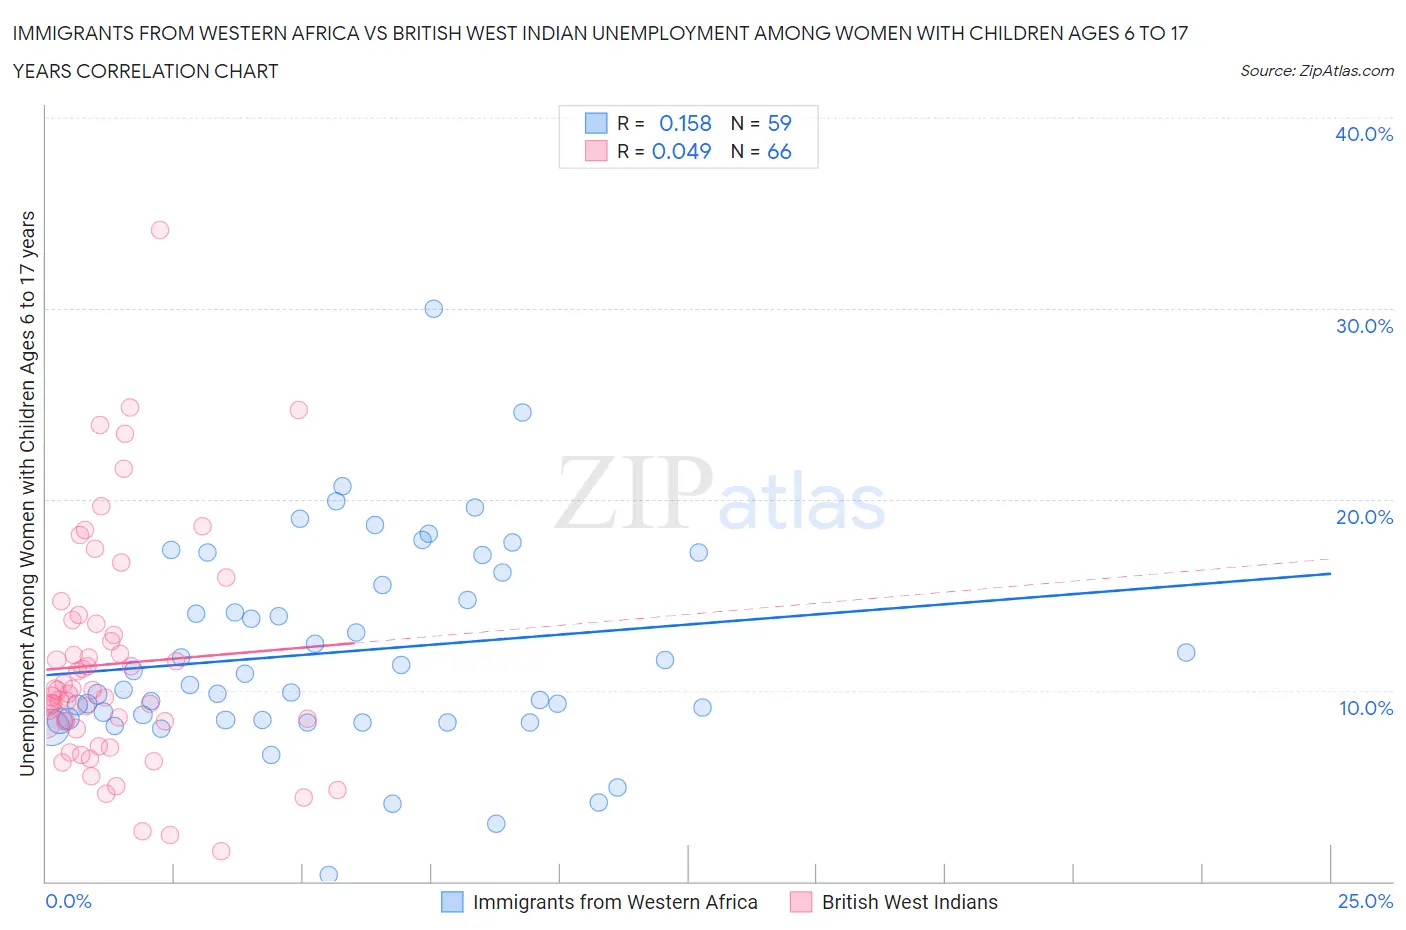
Immigrants from Western Africa vs British West Indian Unemployment Among Women with Children Ages 6 to 17 years Correlation Chart
The statistical analysis conducted on geographies consisting of 270,073,624 people shows a poor positive correlation between the proportion of Immigrants from Western Africa and unemployment rate among women with children between the ages 6 and 17 in the United States with a correlation coefficient (R) of 0.158 and weighted average of 10.1%. Similarly, the statistical analysis conducted on geographies consisting of 128,120,718 people shows no correlation between the proportion of British West Indians and unemployment rate among women with children between the ages 6 and 17 in the United States with a correlation coefficient (R) of 0.049 and weighted average of 9.7%, a difference of 3.8%.
Unemployment Among Women with Children Ages 6 to 17 years Correlation Summary
| Measurement | Immigrants from Western Africa | British West Indian |
| Minimum | 0.30% | 1.6% |
| Maximum | 30.0% | 34.1% |
| Range | 29.7% | 32.5% |
| Mean | 12.0% | 11.4% |
| Median | 10.3% | 9.9% |
| Interquartile 25% (IQ1) | 8.5% | 8.2% |
| Interquartile 75% (IQ3) | 16.2% | 13.5% |
| Interquartile Range (IQR) | 7.7% | 5.4% |
| Standard Deviation (Sample) | 5.4% | 6.0% |
| Standard Deviation (Population) | 5.4% | 6.0% |
Demographics Similar to Immigrants from Western Africa and British West Indians by Unemployment Among Women with Children Ages 6 to 17 years
In terms of unemployment among women with children ages 6 to 17 years, the demographic groups most similar to Immigrants from Western Africa are Cherokee (10.0%, a difference of 0.34%), Ecuadorian (10.0%, a difference of 0.38%), Haitian (10.0%, a difference of 0.47%), Carpatho Rusyn (10.0%, a difference of 0.56%), and Nonimmigrants (10.0%, a difference of 0.57%). Similarly, the demographic groups most similar to British West Indians are Immigrants from Portugal (9.7%, a difference of 0.050%), French (9.7%, a difference of 0.070%), Scotch-Irish (9.7%, a difference of 0.11%), Seminole (9.7%, a difference of 0.29%), and Jamaican (9.8%, a difference of 0.82%).
| Demographics | Rating | Rank | Unemployment Among Women with Children Ages 6 to 17 years |
| Immigrants | Portugal | 0.1 /100 | #276 | Tragic 9.7% |
| British West Indians | 0.1 /100 | #277 | Tragic 9.7% |
| French | 0.1 /100 | #278 | Tragic 9.7% |
| Scotch-Irish | 0.1 /100 | #279 | Tragic 9.7% |
| Seminole | 0.1 /100 | #280 | Tragic 9.7% |
| Jamaicans | 0.0 /100 | #281 | Tragic 9.8% |
| Slovaks | 0.0 /100 | #282 | Tragic 9.8% |
| Central American Indians | 0.0 /100 | #283 | Tragic 9.9% |
| Yakama | 0.0 /100 | #284 | Tragic 9.9% |
| Hispanics or Latinos | 0.0 /100 | #285 | Tragic 9.9% |
| Choctaw | 0.0 /100 | #286 | Tragic 9.9% |
| Sierra Leoneans | 0.0 /100 | #287 | Tragic 9.9% |
| Shoshone | 0.0 /100 | #288 | Tragic 10.0% |
| Hondurans | 0.0 /100 | #289 | Tragic 10.0% |
| Sub-Saharan Africans | 0.0 /100 | #290 | Tragic 10.0% |
| Immigrants | Nonimmigrants | 0.0 /100 | #291 | Tragic 10.0% |
| Carpatho Rusyns | 0.0 /100 | #292 | Tragic 10.0% |
| Haitians | 0.0 /100 | #293 | Tragic 10.0% |
| Ecuadorians | 0.0 /100 | #294 | Tragic 10.0% |
| Cherokee | 0.0 /100 | #295 | Tragic 10.0% |
| Immigrants | Western Africa | 0.0 /100 | #296 | Tragic 10.1% |