Immigrants from Western Africa vs Brazilian Unemployment Among Women with Children Ages 6 to 17 years
COMPARE
Immigrants from Western Africa
Brazilian
Unemployment Among Women with Children Ages 6 to 17 years
Unemployment Among Women with Children Ages 6 to 17 years Comparison
Immigrants from Western Africa
Brazilians
10.1%
UNEMPLOYMENT AMONG WOMEN WITH CHILDREN AGES 6 TO 17 YEARS
0.0/ 100
METRIC RATING
296th/ 347
METRIC RANK
9.1%
UNEMPLOYMENT AMONG WOMEN WITH CHILDREN AGES 6 TO 17 YEARS
24.4/ 100
METRIC RATING
196th/ 347
METRIC RANK
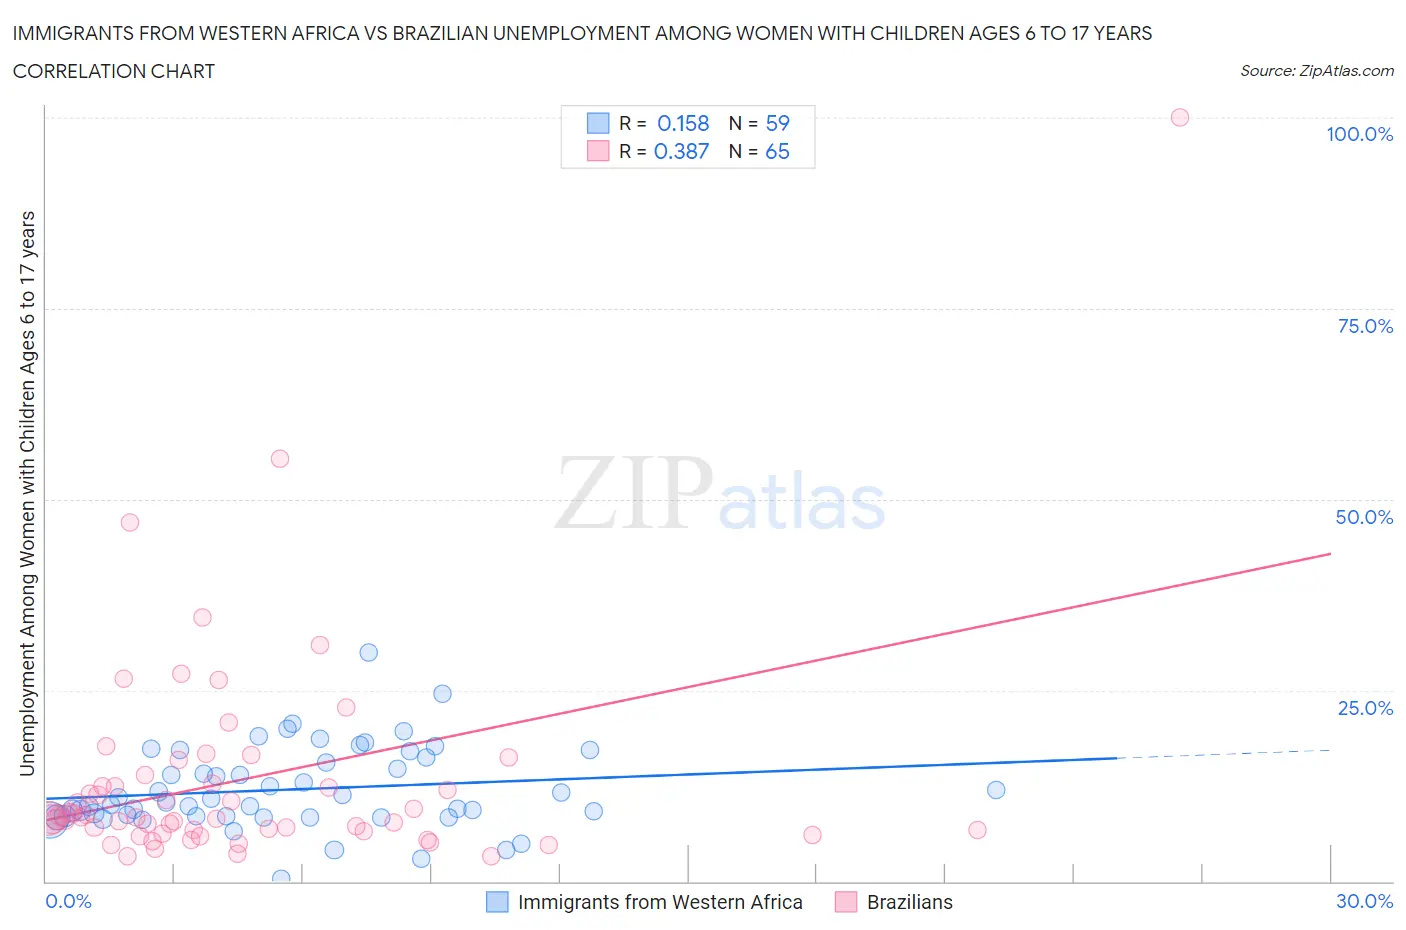
Immigrants from Western Africa vs Brazilian Unemployment Among Women with Children Ages 6 to 17 years Correlation Chart
The statistical analysis conducted on geographies consisting of 270,073,624 people shows a poor positive correlation between the proportion of Immigrants from Western Africa and unemployment rate among women with children between the ages 6 and 17 in the United States with a correlation coefficient (R) of 0.158 and weighted average of 10.1%. Similarly, the statistical analysis conducted on geographies consisting of 240,779,171 people shows a mild positive correlation between the proportion of Brazilians and unemployment rate among women with children between the ages 6 and 17 in the United States with a correlation coefficient (R) of 0.387 and weighted average of 9.1%, a difference of 10.9%.
Unemployment Among Women with Children Ages 6 to 17 years Correlation Summary
| Measurement | Immigrants from Western Africa | Brazilian |
| Minimum | 0.30% | 3.3% |
| Maximum | 30.0% | 100.0% |
| Range | 29.7% | 96.7% |
| Mean | 12.0% | 13.3% |
| Median | 10.3% | 8.4% |
| Interquartile 25% (IQ1) | 8.5% | 6.7% |
| Interquartile 75% (IQ3) | 16.2% | 13.3% |
| Interquartile Range (IQR) | 7.7% | 6.7% |
| Standard Deviation (Sample) | 5.4% | 14.7% |
| Standard Deviation (Population) | 5.4% | 14.5% |
Similar Demographics by Unemployment Among Women with Children Ages 6 to 17 years
Demographics Similar to Immigrants from Western Africa by Unemployment Among Women with Children Ages 6 to 17 years
In terms of unemployment among women with children ages 6 to 17 years, the demographic groups most similar to Immigrants from Western Africa are Immigrants from Caribbean (10.1%, a difference of 0.020%), Immigrants from Haiti (10.1%, a difference of 0.32%), Cherokee (10.0%, a difference of 0.34%), Immigrants from Honduras (10.1%, a difference of 0.34%), and Nigerian (10.1%, a difference of 0.36%).
| Demographics | Rating | Rank | Unemployment Among Women with Children Ages 6 to 17 years |
| Hondurans | 0.0 /100 | #289 | Tragic 10.0% |
| Sub-Saharan Africans | 0.0 /100 | #290 | Tragic 10.0% |
| Immigrants | Nonimmigrants | 0.0 /100 | #291 | Tragic 10.0% |
| Carpatho Rusyns | 0.0 /100 | #292 | Tragic 10.0% |
| Haitians | 0.0 /100 | #293 | Tragic 10.0% |
| Ecuadorians | 0.0 /100 | #294 | Tragic 10.0% |
| Cherokee | 0.0 /100 | #295 | Tragic 10.0% |
| Immigrants | Western Africa | 0.0 /100 | #296 | Tragic 10.1% |
| Immigrants | Caribbean | 0.0 /100 | #297 | Tragic 10.1% |
| Immigrants | Haiti | 0.0 /100 | #298 | Tragic 10.1% |
| Immigrants | Honduras | 0.0 /100 | #299 | Tragic 10.1% |
| Nigerians | 0.0 /100 | #300 | Tragic 10.1% |
| Immigrants | Bahamas | 0.0 /100 | #301 | Tragic 10.1% |
| Venezuelans | 0.0 /100 | #302 | Tragic 10.2% |
| Immigrants | Ecuador | 0.0 /100 | #303 | Tragic 10.2% |
Demographics Similar to Brazilians by Unemployment Among Women with Children Ages 6 to 17 years
In terms of unemployment among women with children ages 6 to 17 years, the demographic groups most similar to Brazilians are Immigrants from Panama (9.1%, a difference of 0.010%), Austrian (9.1%, a difference of 0.030%), Immigrants from Kazakhstan (9.1%, a difference of 0.050%), Immigrants from Turkey (9.1%, a difference of 0.080%), and Guamanian/Chamorro (9.1%, a difference of 0.16%).
| Demographics | Rating | Rank | Unemployment Among Women with Children Ages 6 to 17 years |
| Immigrants | Immigrants | 29.2 /100 | #189 | Fair 9.1% |
| Slovenes | 28.5 /100 | #190 | Fair 9.1% |
| Belizeans | 28.4 /100 | #191 | Fair 9.1% |
| Guamanians/Chamorros | 27.2 /100 | #192 | Fair 9.1% |
| Immigrants | Turkey | 25.8 /100 | #193 | Fair 9.1% |
| Immigrants | Kazakhstan | 25.3 /100 | #194 | Fair 9.1% |
| Austrians | 25.0 /100 | #195 | Fair 9.1% |
| Brazilians | 24.4 /100 | #196 | Fair 9.1% |
| Immigrants | Panama | 24.3 /100 | #197 | Fair 9.1% |
| Guyanese | 21.8 /100 | #198 | Fair 9.1% |
| Czechoslovakians | 20.8 /100 | #199 | Fair 9.1% |
| Trinidadians and Tobagonians | 18.2 /100 | #200 | Poor 9.1% |
| Immigrants | Trinidad and Tobago | 16.7 /100 | #201 | Poor 9.1% |
| Immigrants | Middle Africa | 15.6 /100 | #202 | Poor 9.1% |
| Maltese | 15.3 /100 | #203 | Poor 9.1% |