Immigrants from Western Africa vs Turkish Unemployment Among Women with Children Ages 6 to 17 years
COMPARE
Immigrants from Western Africa
Turkish
Unemployment Among Women with Children Ages 6 to 17 years
Unemployment Among Women with Children Ages 6 to 17 years Comparison
Immigrants from Western Africa
Turks
10.1%
UNEMPLOYMENT AMONG WOMEN WITH CHILDREN AGES 6 TO 17 YEARS
0.0/ 100
METRIC RATING
296th/ 347
METRIC RANK
8.9%
UNEMPLOYMENT AMONG WOMEN WITH CHILDREN AGES 6 TO 17 YEARS
54.1/ 100
METRIC RATING
170th/ 347
METRIC RANK
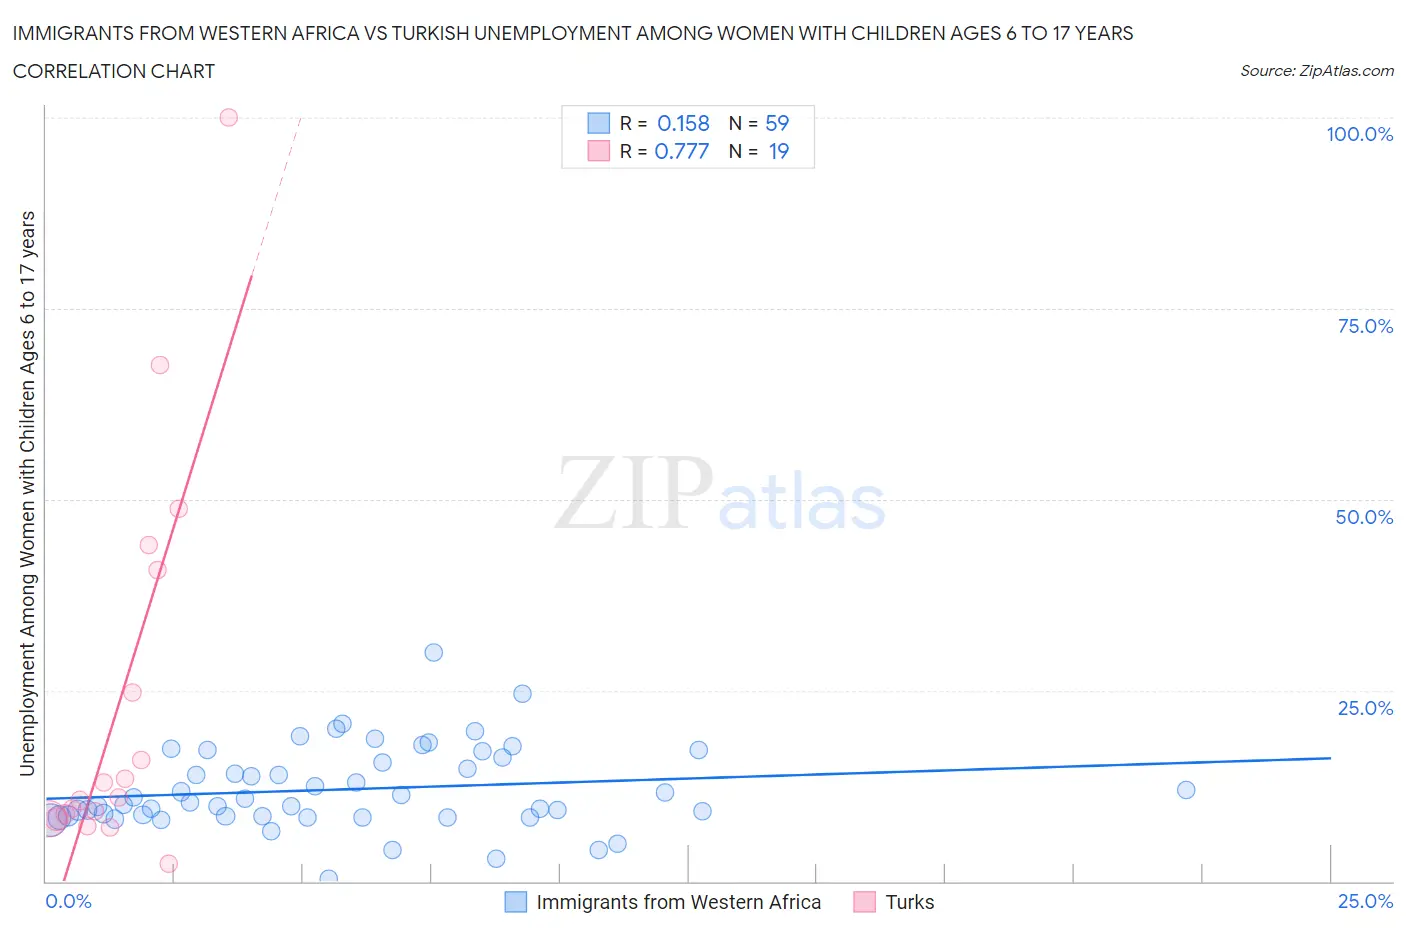
Immigrants from Western Africa vs Turkish Unemployment Among Women with Children Ages 6 to 17 years Correlation Chart
The statistical analysis conducted on geographies consisting of 270,073,624 people shows a poor positive correlation between the proportion of Immigrants from Western Africa and unemployment rate among women with children between the ages 6 and 17 in the United States with a correlation coefficient (R) of 0.158 and weighted average of 10.1%. Similarly, the statistical analysis conducted on geographies consisting of 207,852,412 people shows a strong positive correlation between the proportion of Turks and unemployment rate among women with children between the ages 6 and 17 in the United States with a correlation coefficient (R) of 0.777 and weighted average of 8.9%, a difference of 12.5%.
Unemployment Among Women with Children Ages 6 to 17 years Correlation Summary
| Measurement | Immigrants from Western Africa | Turkish |
| Minimum | 0.30% | 2.3% |
| Maximum | 30.0% | 100.0% |
| Range | 29.7% | 97.7% |
| Mean | 12.0% | 23.7% |
| Median | 10.3% | 10.9% |
| Interquartile 25% (IQ1) | 8.5% | 8.2% |
| Interquartile 75% (IQ3) | 16.2% | 40.8% |
| Interquartile Range (IQR) | 7.7% | 32.6% |
| Standard Deviation (Sample) | 5.4% | 25.6% |
| Standard Deviation (Population) | 5.4% | 25.0% |
Similar Demographics by Unemployment Among Women with Children Ages 6 to 17 years
Demographics Similar to Immigrants from Western Africa by Unemployment Among Women with Children Ages 6 to 17 years
In terms of unemployment among women with children ages 6 to 17 years, the demographic groups most similar to Immigrants from Western Africa are Immigrants from Caribbean (10.1%, a difference of 0.020%), Immigrants from Haiti (10.1%, a difference of 0.32%), Cherokee (10.0%, a difference of 0.34%), Immigrants from Honduras (10.1%, a difference of 0.34%), and Nigerian (10.1%, a difference of 0.36%).
| Demographics | Rating | Rank | Unemployment Among Women with Children Ages 6 to 17 years |
| Hondurans | 0.0 /100 | #289 | Tragic 10.0% |
| Sub-Saharan Africans | 0.0 /100 | #290 | Tragic 10.0% |
| Immigrants | Nonimmigrants | 0.0 /100 | #291 | Tragic 10.0% |
| Carpatho Rusyns | 0.0 /100 | #292 | Tragic 10.0% |
| Haitians | 0.0 /100 | #293 | Tragic 10.0% |
| Ecuadorians | 0.0 /100 | #294 | Tragic 10.0% |
| Cherokee | 0.0 /100 | #295 | Tragic 10.0% |
| Immigrants | Western Africa | 0.0 /100 | #296 | Tragic 10.1% |
| Immigrants | Caribbean | 0.0 /100 | #297 | Tragic 10.1% |
| Immigrants | Haiti | 0.0 /100 | #298 | Tragic 10.1% |
| Immigrants | Honduras | 0.0 /100 | #299 | Tragic 10.1% |
| Nigerians | 0.0 /100 | #300 | Tragic 10.1% |
| Immigrants | Bahamas | 0.0 /100 | #301 | Tragic 10.1% |
| Venezuelans | 0.0 /100 | #302 | Tragic 10.2% |
| Immigrants | Ecuador | 0.0 /100 | #303 | Tragic 10.2% |
Demographics Similar to Turks by Unemployment Among Women with Children Ages 6 to 17 years
In terms of unemployment among women with children ages 6 to 17 years, the demographic groups most similar to Turks are British (8.9%, a difference of 0.050%), Jordanian (9.0%, a difference of 0.090%), Immigrants from West Indies (9.0%, a difference of 0.090%), Immigrants from Croatia (8.9%, a difference of 0.13%), and Immigrants from Brazil (9.0%, a difference of 0.14%).
| Demographics | Rating | Rank | Unemployment Among Women with Children Ages 6 to 17 years |
| Mexican American Indians | 60.6 /100 | #163 | Good 8.9% |
| Ukrainians | 59.7 /100 | #164 | Average 8.9% |
| Immigrants | Micronesia | 59.2 /100 | #165 | Average 8.9% |
| Moroccans | 58.3 /100 | #166 | Average 8.9% |
| Immigrants | England | 57.7 /100 | #167 | Average 8.9% |
| Immigrants | Croatia | 57.1 /100 | #168 | Average 8.9% |
| British | 55.2 /100 | #169 | Average 8.9% |
| Turks | 54.1 /100 | #170 | Average 8.9% |
| Jordanians | 52.2 /100 | #171 | Average 9.0% |
| Immigrants | West Indies | 52.2 /100 | #172 | Average 9.0% |
| Immigrants | Brazil | 51.0 /100 | #173 | Average 9.0% |
| Immigrants | Costa Rica | 50.0 /100 | #174 | Average 9.0% |
| Immigrants | Sierra Leone | 45.9 /100 | #175 | Average 9.0% |
| Immigrants | Italy | 43.7 /100 | #176 | Average 9.0% |
| Immigrants | Jordan | 41.6 /100 | #177 | Average 9.0% |