Immigrants from West Indies vs Inupiat Unemployment
COMPARE
Immigrants from West Indies
Inupiat
Unemployment
Unemployment Comparison
Immigrants from West Indies
Inupiat
6.3%
UNEMPLOYMENT
0.0/ 100
METRIC RATING
299th/ 347
METRIC RANK
10.1%
UNEMPLOYMENT
0.0/ 100
METRIC RATING
345th/ 347
METRIC RANK
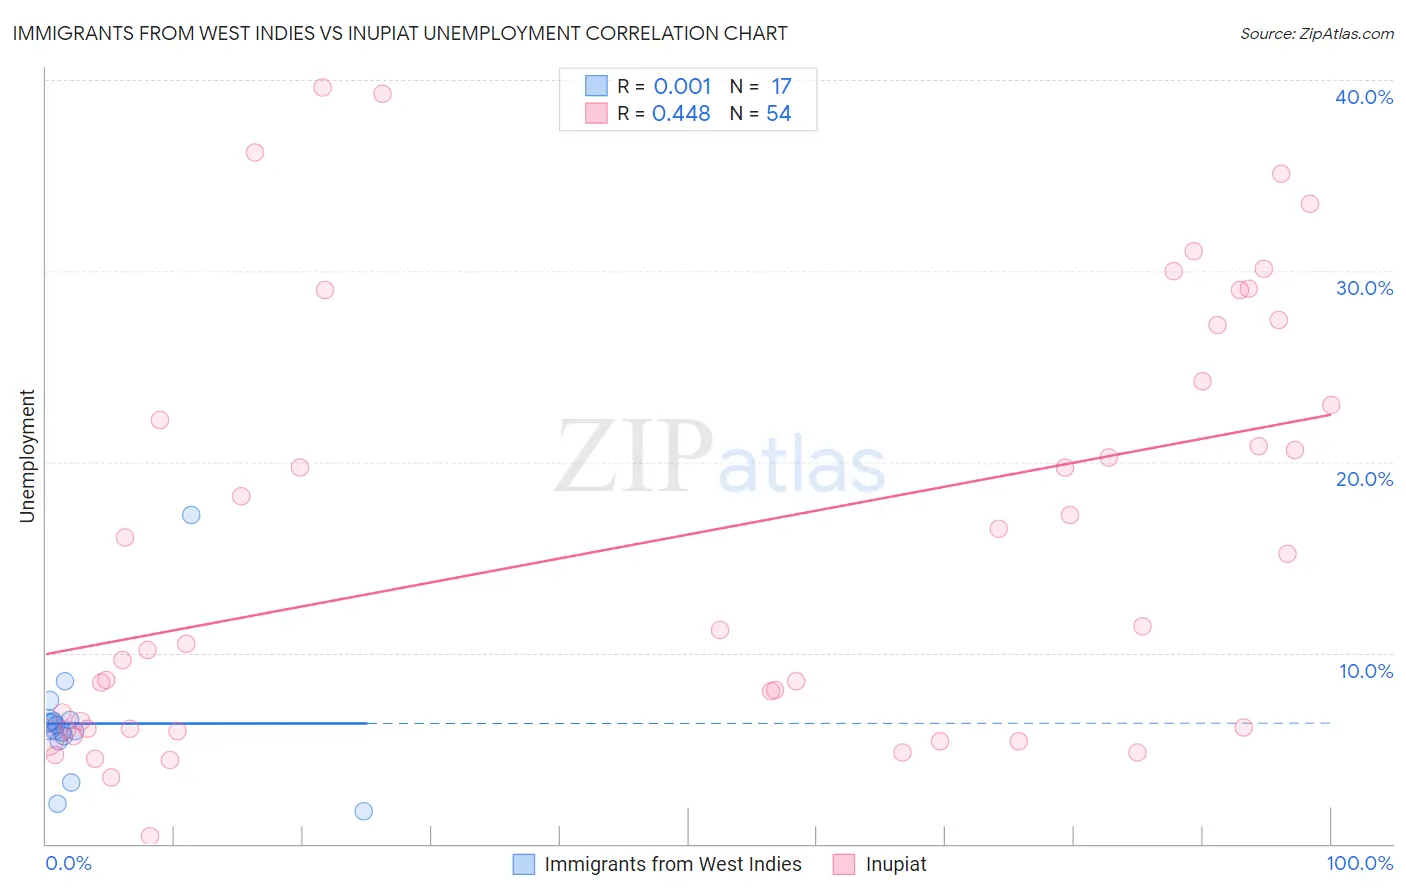
Immigrants from West Indies vs Inupiat Unemployment Correlation Chart
The statistical analysis conducted on geographies consisting of 72,442,388 people shows no correlation between the proportion of Immigrants from West Indies and unemployment in the United States with a correlation coefficient (R) of 0.001 and weighted average of 6.3%. Similarly, the statistical analysis conducted on geographies consisting of 96,296,891 people shows a moderate positive correlation between the proportion of Inupiat and unemployment in the United States with a correlation coefficient (R) of 0.448 and weighted average of 10.1%, a difference of 60.3%.
Unemployment Correlation Summary
| Measurement | Immigrants from West Indies | Inupiat |
| Minimum | 1.7% | 0.40% |
| Maximum | 17.2% | 39.6% |
| Range | 15.5% | 39.2% |
| Mean | 6.3% | 15.9% |
| Median | 6.2% | 11.3% |
| Interquartile 25% (IQ1) | 5.5% | 6.0% |
| Interquartile 75% (IQ3) | 6.5% | 24.2% |
| Interquartile Range (IQR) | 0.97% | 18.2% |
| Standard Deviation (Sample) | 3.3% | 11.0% |
| Standard Deviation (Population) | 3.2% | 10.9% |
Similar Demographics by Unemployment
Demographics Similar to Immigrants from West Indies by Unemployment
In terms of unemployment, the demographic groups most similar to Immigrants from West Indies are Immigrants from Haiti (6.3%, a difference of 0.050%), Immigrants from Trinidad and Tobago (6.3%, a difference of 0.12%), Jamaican (6.3%, a difference of 0.14%), Ute (6.3%, a difference of 0.48%), and Trinidadian and Tobagonian (6.3%, a difference of 0.60%).
| Demographics | Rating | Rank | Unemployment |
| Central American Indians | 0.0 /100 | #292 | Tragic 6.2% |
| Immigrants | Ecuador | 0.0 /100 | #293 | Tragic 6.2% |
| Spanish American Indians | 0.0 /100 | #294 | Tragic 6.2% |
| U.S. Virgin Islanders | 0.0 /100 | #295 | Tragic 6.3% |
| Ute | 0.0 /100 | #296 | Tragic 6.3% |
| Jamaicans | 0.0 /100 | #297 | Tragic 6.3% |
| Immigrants | Haiti | 0.0 /100 | #298 | Tragic 6.3% |
| Immigrants | West Indies | 0.0 /100 | #299 | Tragic 6.3% |
| Immigrants | Trinidad and Tobago | 0.0 /100 | #300 | Tragic 6.3% |
| Trinidadians and Tobagonians | 0.0 /100 | #301 | Tragic 6.3% |
| West Indians | 0.0 /100 | #302 | Tragic 6.4% |
| Belizeans | 0.0 /100 | #303 | Tragic 6.4% |
| Immigrants | Jamaica | 0.0 /100 | #304 | Tragic 6.4% |
| Menominee | 0.0 /100 | #305 | Tragic 6.4% |
| Lumbee | 0.0 /100 | #306 | Tragic 6.4% |
Demographics Similar to Inupiat by Unemployment
In terms of unemployment, the demographic groups most similar to Inupiat are Arapaho (9.8%, a difference of 2.9%), Crow (11.1%, a difference of 9.4%), Yuman (9.1%, a difference of 11.6%), Hopi (8.9%, a difference of 13.5%), and Tohono O'odham (8.9%, a difference of 14.0%).
| Demographics | Rating | Rank | Unemployment |
| Immigrants | Dominican Republic | 0.0 /100 | #333 | Tragic 7.4% |
| Apache | 0.0 /100 | #334 | Tragic 7.4% |
| Alaskan Athabascans | 0.0 /100 | #335 | Tragic 7.7% |
| Immigrants | Yemen | 0.0 /100 | #336 | Tragic 7.7% |
| Cheyenne | 0.0 /100 | #337 | Tragic 8.0% |
| Pima | 0.0 /100 | #338 | Tragic 8.2% |
| Navajo | 0.0 /100 | #339 | Tragic 8.4% |
| Puerto Ricans | 0.0 /100 | #340 | Tragic 8.4% |
| Tohono O'odham | 0.0 /100 | #341 | Tragic 8.9% |
| Hopi | 0.0 /100 | #342 | Tragic 8.9% |
| Yuman | 0.0 /100 | #343 | Tragic 9.1% |
| Arapaho | 0.0 /100 | #344 | Tragic 9.8% |
| Inupiat | 0.0 /100 | #345 | Tragic 10.1% |
| Crow | 0.0 /100 | #346 | Tragic 11.1% |
| Yup'ik | 0.0 /100 | #347 | Tragic 13.6% |