Immigrants from West Indies vs Immigrants from Iraq Unemployment
COMPARE
Immigrants from West Indies
Immigrants from Iraq
Unemployment
Unemployment Comparison
Immigrants from West Indies
Immigrants from Iraq
6.3%
UNEMPLOYMENT
0.0/ 100
METRIC RATING
299th/ 347
METRIC RANK
5.4%
UNEMPLOYMENT
18.6/ 100
METRIC RATING
210th/ 347
METRIC RANK
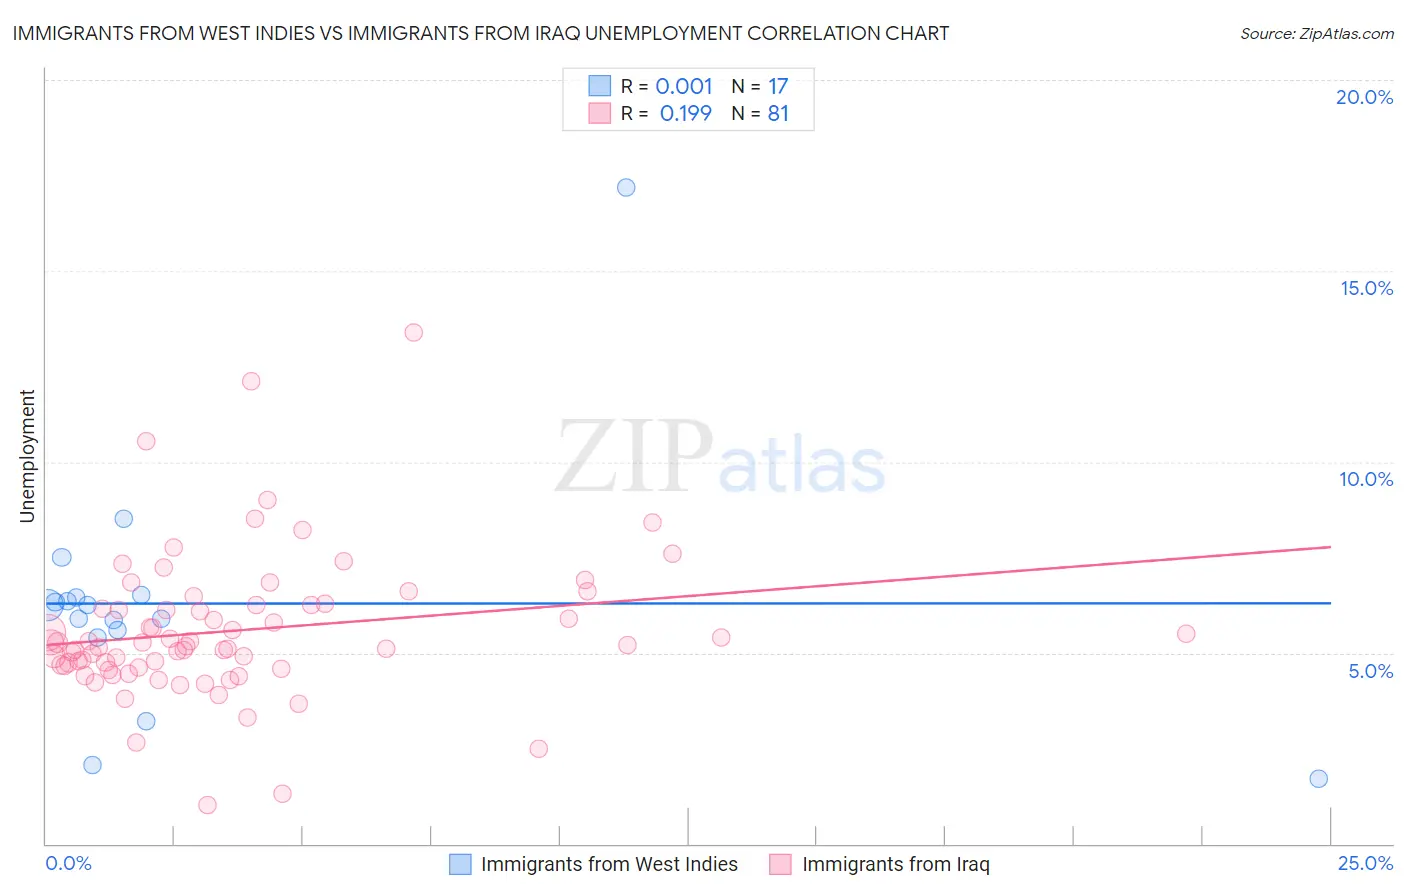
Immigrants from West Indies vs Immigrants from Iraq Unemployment Correlation Chart
The statistical analysis conducted on geographies consisting of 72,442,388 people shows no correlation between the proportion of Immigrants from West Indies and unemployment in the United States with a correlation coefficient (R) of 0.001 and weighted average of 6.3%. Similarly, the statistical analysis conducted on geographies consisting of 194,739,178 people shows a poor positive correlation between the proportion of Immigrants from Iraq and unemployment in the United States with a correlation coefficient (R) of 0.199 and weighted average of 5.4%, a difference of 17.3%.
Unemployment Correlation Summary
| Measurement | Immigrants from West Indies | Immigrants from Iraq |
| Minimum | 1.7% | 1.0% |
| Maximum | 17.2% | 13.4% |
| Range | 15.5% | 12.4% |
| Mean | 6.3% | 5.6% |
| Median | 6.2% | 5.2% |
| Interquartile 25% (IQ1) | 5.5% | 4.6% |
| Interquartile 75% (IQ3) | 6.5% | 6.3% |
| Interquartile Range (IQR) | 0.97% | 1.6% |
| Standard Deviation (Sample) | 3.3% | 1.9% |
| Standard Deviation (Population) | 3.2% | 1.9% |
Similar Demographics by Unemployment
Demographics Similar to Immigrants from West Indies by Unemployment
In terms of unemployment, the demographic groups most similar to Immigrants from West Indies are Immigrants from Haiti (6.3%, a difference of 0.050%), Immigrants from Trinidad and Tobago (6.3%, a difference of 0.12%), Jamaican (6.3%, a difference of 0.14%), Ute (6.3%, a difference of 0.48%), and Trinidadian and Tobagonian (6.3%, a difference of 0.60%).
| Demographics | Rating | Rank | Unemployment |
| Central American Indians | 0.0 /100 | #292 | Tragic 6.2% |
| Immigrants | Ecuador | 0.0 /100 | #293 | Tragic 6.2% |
| Spanish American Indians | 0.0 /100 | #294 | Tragic 6.2% |
| U.S. Virgin Islanders | 0.0 /100 | #295 | Tragic 6.3% |
| Ute | 0.0 /100 | #296 | Tragic 6.3% |
| Jamaicans | 0.0 /100 | #297 | Tragic 6.3% |
| Immigrants | Haiti | 0.0 /100 | #298 | Tragic 6.3% |
| Immigrants | West Indies | 0.0 /100 | #299 | Tragic 6.3% |
| Immigrants | Trinidad and Tobago | 0.0 /100 | #300 | Tragic 6.3% |
| Trinidadians and Tobagonians | 0.0 /100 | #301 | Tragic 6.3% |
| West Indians | 0.0 /100 | #302 | Tragic 6.4% |
| Belizeans | 0.0 /100 | #303 | Tragic 6.4% |
| Immigrants | Jamaica | 0.0 /100 | #304 | Tragic 6.4% |
| Menominee | 0.0 /100 | #305 | Tragic 6.4% |
| Lumbee | 0.0 /100 | #306 | Tragic 6.4% |
Demographics Similar to Immigrants from Iraq by Unemployment
In terms of unemployment, the demographic groups most similar to Immigrants from Iraq are Immigrants from Iran (5.4%, a difference of 0.020%), Portuguese (5.4%, a difference of 0.050%), Iraqi (5.4%, a difference of 0.050%), Ugandan (5.4%, a difference of 0.060%), and Creek (5.4%, a difference of 0.080%).
| Demographics | Rating | Rank | Unemployment |
| Immigrants | Micronesia | 25.2 /100 | #203 | Fair 5.3% |
| Immigrants | Ukraine | 24.9 /100 | #204 | Fair 5.3% |
| Native Hawaiians | 24.1 /100 | #205 | Fair 5.3% |
| Immigrants | Peru | 22.7 /100 | #206 | Fair 5.4% |
| Creek | 19.4 /100 | #207 | Poor 5.4% |
| Portuguese | 19.0 /100 | #208 | Poor 5.4% |
| Immigrants | Iran | 18.8 /100 | #209 | Poor 5.4% |
| Immigrants | Iraq | 18.6 /100 | #210 | Poor 5.4% |
| Iraqis | 18.1 /100 | #211 | Poor 5.4% |
| Ugandans | 18.0 /100 | #212 | Poor 5.4% |
| Immigrants | Middle Africa | 15.3 /100 | #213 | Poor 5.4% |
| Immigrants | Costa Rica | 15.2 /100 | #214 | Poor 5.4% |
| Delaware | 14.7 /100 | #215 | Poor 5.4% |
| Immigrants | South America | 13.5 /100 | #216 | Poor 5.4% |
| Immigrants | Albania | 13.5 /100 | #217 | Poor 5.4% |