Immigrants from West Indies vs Blackfeet Unemployment
COMPARE
Immigrants from West Indies
Blackfeet
Unemployment
Unemployment Comparison
Immigrants from West Indies
Blackfeet
6.3%
UNEMPLOYMENT
0.0/ 100
METRIC RATING
299th/ 347
METRIC RANK
5.8%
UNEMPLOYMENT
0.1/ 100
METRIC RATING
270th/ 347
METRIC RANK
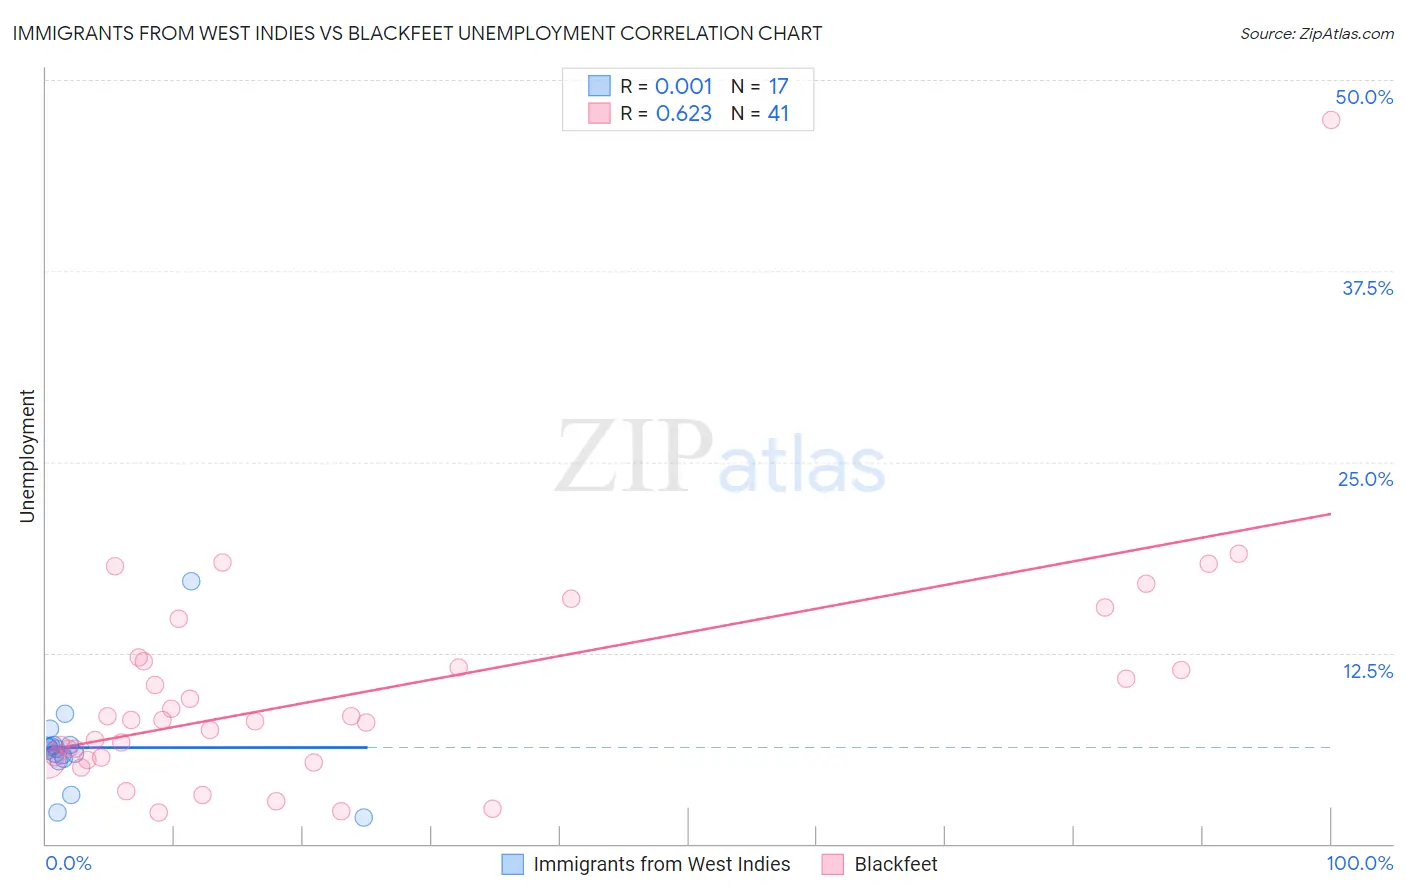
Immigrants from West Indies vs Blackfeet Unemployment Correlation Chart
The statistical analysis conducted on geographies consisting of 72,442,388 people shows no correlation between the proportion of Immigrants from West Indies and unemployment in the United States with a correlation coefficient (R) of 0.001 and weighted average of 6.3%. Similarly, the statistical analysis conducted on geographies consisting of 309,227,999 people shows a significant positive correlation between the proportion of Blackfeet and unemployment in the United States with a correlation coefficient (R) of 0.623 and weighted average of 5.8%, a difference of 7.9%.
Unemployment Correlation Summary
| Measurement | Immigrants from West Indies | Blackfeet |
| Minimum | 1.7% | 2.0% |
| Maximum | 17.2% | 47.4% |
| Range | 15.5% | 45.4% |
| Mean | 6.3% | 10.0% |
| Median | 6.2% | 8.1% |
| Interquartile 25% (IQ1) | 5.5% | 5.6% |
| Interquartile 75% (IQ3) | 6.5% | 12.1% |
| Interquartile Range (IQR) | 0.97% | 6.5% |
| Standard Deviation (Sample) | 3.3% | 7.7% |
| Standard Deviation (Population) | 3.2% | 7.6% |
Similar Demographics by Unemployment
Demographics Similar to Immigrants from West Indies by Unemployment
In terms of unemployment, the demographic groups most similar to Immigrants from West Indies are Immigrants from Haiti (6.3%, a difference of 0.050%), Immigrants from Trinidad and Tobago (6.3%, a difference of 0.12%), Jamaican (6.3%, a difference of 0.14%), Ute (6.3%, a difference of 0.48%), and Trinidadian and Tobagonian (6.3%, a difference of 0.60%).
| Demographics | Rating | Rank | Unemployment |
| Central American Indians | 0.0 /100 | #292 | Tragic 6.2% |
| Immigrants | Ecuador | 0.0 /100 | #293 | Tragic 6.2% |
| Spanish American Indians | 0.0 /100 | #294 | Tragic 6.2% |
| U.S. Virgin Islanders | 0.0 /100 | #295 | Tragic 6.3% |
| Ute | 0.0 /100 | #296 | Tragic 6.3% |
| Jamaicans | 0.0 /100 | #297 | Tragic 6.3% |
| Immigrants | Haiti | 0.0 /100 | #298 | Tragic 6.3% |
| Immigrants | West Indies | 0.0 /100 | #299 | Tragic 6.3% |
| Immigrants | Trinidad and Tobago | 0.0 /100 | #300 | Tragic 6.3% |
| Trinidadians and Tobagonians | 0.0 /100 | #301 | Tragic 6.3% |
| West Indians | 0.0 /100 | #302 | Tragic 6.4% |
| Belizeans | 0.0 /100 | #303 | Tragic 6.4% |
| Immigrants | Jamaica | 0.0 /100 | #304 | Tragic 6.4% |
| Menominee | 0.0 /100 | #305 | Tragic 6.4% |
| Lumbee | 0.0 /100 | #306 | Tragic 6.4% |
Demographics Similar to Blackfeet by Unemployment
In terms of unemployment, the demographic groups most similar to Blackfeet are Immigrants from El Salvador (5.8%, a difference of 0.080%), Immigrants from Sierra Leone (5.8%, a difference of 0.090%), Immigrants from Nigeria (5.8%, a difference of 0.13%), Mexican American Indian (5.8%, a difference of 0.20%), and Mexican (5.9%, a difference of 0.23%).
| Demographics | Rating | Rank | Unemployment |
| Salvadorans | 0.1 /100 | #263 | Tragic 5.8% |
| Immigrants | Liberia | 0.1 /100 | #264 | Tragic 5.8% |
| Nigerians | 0.1 /100 | #265 | Tragic 5.8% |
| Mexican American Indians | 0.1 /100 | #266 | Tragic 5.8% |
| Immigrants | Nigeria | 0.1 /100 | #267 | Tragic 5.8% |
| Immigrants | Sierra Leone | 0.1 /100 | #268 | Tragic 5.8% |
| Immigrants | El Salvador | 0.1 /100 | #269 | Tragic 5.8% |
| Blackfeet | 0.1 /100 | #270 | Tragic 5.8% |
| Mexicans | 0.1 /100 | #271 | Tragic 5.9% |
| Hispanics or Latinos | 0.0 /100 | #272 | Tragic 5.9% |
| Immigrants | Fiji | 0.0 /100 | #273 | Tragic 5.9% |
| Bahamians | 0.0 /100 | #274 | Tragic 5.9% |
| Immigrants | Latin America | 0.0 /100 | #275 | Tragic 5.9% |
| Immigrants | Central America | 0.0 /100 | #276 | Tragic 6.0% |
| Armenians | 0.0 /100 | #277 | Tragic 6.0% |