Immigrants from West Indies vs Vietnamese Unemployment
COMPARE
Immigrants from West Indies
Vietnamese
Unemployment
Unemployment Comparison
Immigrants from West Indies
Vietnamese
6.3%
UNEMPLOYMENT
0.0/ 100
METRIC RATING
299th/ 347
METRIC RANK
6.5%
UNEMPLOYMENT
0.0/ 100
METRIC RATING
309th/ 347
METRIC RANK
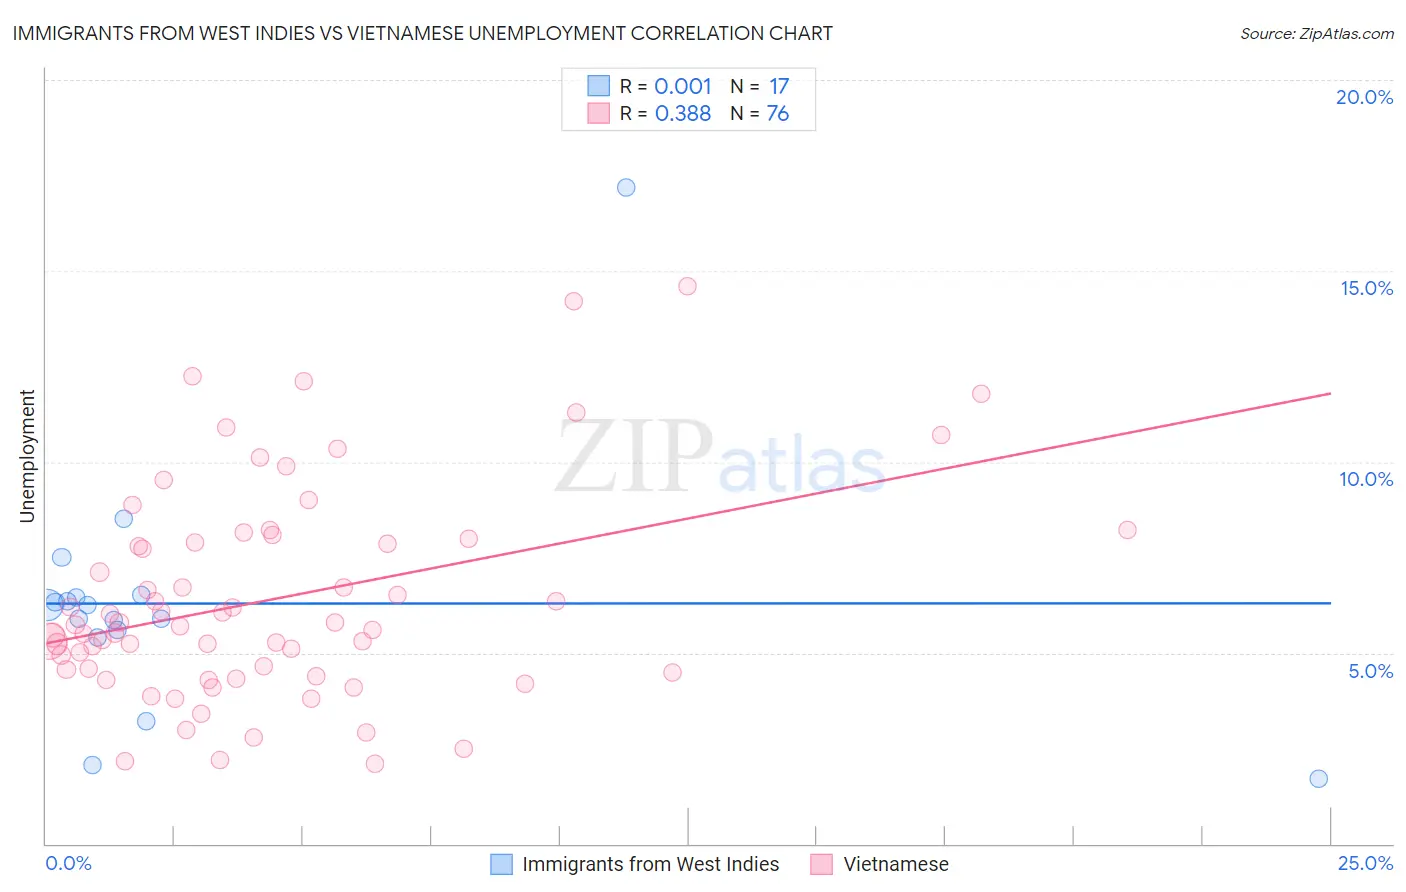
Immigrants from West Indies vs Vietnamese Unemployment Correlation Chart
The statistical analysis conducted on geographies consisting of 72,442,388 people shows no correlation between the proportion of Immigrants from West Indies and unemployment in the United States with a correlation coefficient (R) of 0.001 and weighted average of 6.3%. Similarly, the statistical analysis conducted on geographies consisting of 170,737,868 people shows a mild positive correlation between the proportion of Vietnamese and unemployment in the United States with a correlation coefficient (R) of 0.388 and weighted average of 6.5%, a difference of 2.9%.
Unemployment Correlation Summary
| Measurement | Immigrants from West Indies | Vietnamese |
| Minimum | 1.7% | 2.1% |
| Maximum | 17.2% | 14.6% |
| Range | 15.5% | 12.5% |
| Mean | 6.3% | 6.4% |
| Median | 6.2% | 5.7% |
| Interquartile 25% (IQ1) | 5.5% | 4.5% |
| Interquartile 75% (IQ3) | 6.5% | 8.0% |
| Interquartile Range (IQR) | 0.97% | 3.4% |
| Standard Deviation (Sample) | 3.3% | 2.8% |
| Standard Deviation (Population) | 3.2% | 2.8% |
Demographics Similar to Immigrants from West Indies and Vietnamese by Unemployment
In terms of unemployment, the demographic groups most similar to Immigrants from West Indies are Immigrants from Haiti (6.3%, a difference of 0.050%), Immigrants from Trinidad and Tobago (6.3%, a difference of 0.12%), Jamaican (6.3%, a difference of 0.14%), Ute (6.3%, a difference of 0.48%), and Trinidadian and Tobagonian (6.3%, a difference of 0.60%). Similarly, the demographic groups most similar to Vietnamese are Barbadian (6.5%, a difference of 0.010%), Immigrants from Belize (6.5%, a difference of 0.27%), Immigrants from Bangladesh (6.5%, a difference of 0.38%), Cape Verdean (6.5%, a difference of 0.60%), and Lumbee (6.4%, a difference of 0.87%).
| Demographics | Rating | Rank | Unemployment |
| Spanish American Indians | 0.0 /100 | #294 | Tragic 6.2% |
| U.S. Virgin Islanders | 0.0 /100 | #295 | Tragic 6.3% |
| Ute | 0.0 /100 | #296 | Tragic 6.3% |
| Jamaicans | 0.0 /100 | #297 | Tragic 6.3% |
| Immigrants | Haiti | 0.0 /100 | #298 | Tragic 6.3% |
| Immigrants | West Indies | 0.0 /100 | #299 | Tragic 6.3% |
| Immigrants | Trinidad and Tobago | 0.0 /100 | #300 | Tragic 6.3% |
| Trinidadians and Tobagonians | 0.0 /100 | #301 | Tragic 6.3% |
| West Indians | 0.0 /100 | #302 | Tragic 6.4% |
| Belizeans | 0.0 /100 | #303 | Tragic 6.4% |
| Immigrants | Jamaica | 0.0 /100 | #304 | Tragic 6.4% |
| Menominee | 0.0 /100 | #305 | Tragic 6.4% |
| Lumbee | 0.0 /100 | #306 | Tragic 6.4% |
| Immigrants | Bangladesh | 0.0 /100 | #307 | Tragic 6.5% |
| Barbadians | 0.0 /100 | #308 | Tragic 6.5% |
| Vietnamese | 0.0 /100 | #309 | Tragic 6.5% |
| Immigrants | Belize | 0.0 /100 | #310 | Tragic 6.5% |
| Cape Verdeans | 0.0 /100 | #311 | Tragic 6.5% |
| Colville | 0.0 /100 | #312 | Tragic 6.6% |
| Immigrants | Barbados | 0.0 /100 | #313 | Tragic 6.6% |
| Blacks/African Americans | 0.0 /100 | #314 | Tragic 6.6% |