Immigrants from Uganda vs Immigrants from Cabo Verde Unemployment
COMPARE
Immigrants from Uganda
Immigrants from Cabo Verde
Unemployment
Unemployment Comparison
Immigrants from Uganda
Immigrants from Cabo Verde
5.3%
UNEMPLOYMENT
37.8/ 100
METRIC RATING
186th/ 347
METRIC RANK
6.8%
UNEMPLOYMENT
0.0/ 100
METRIC RATING
318th/ 347
METRIC RANK
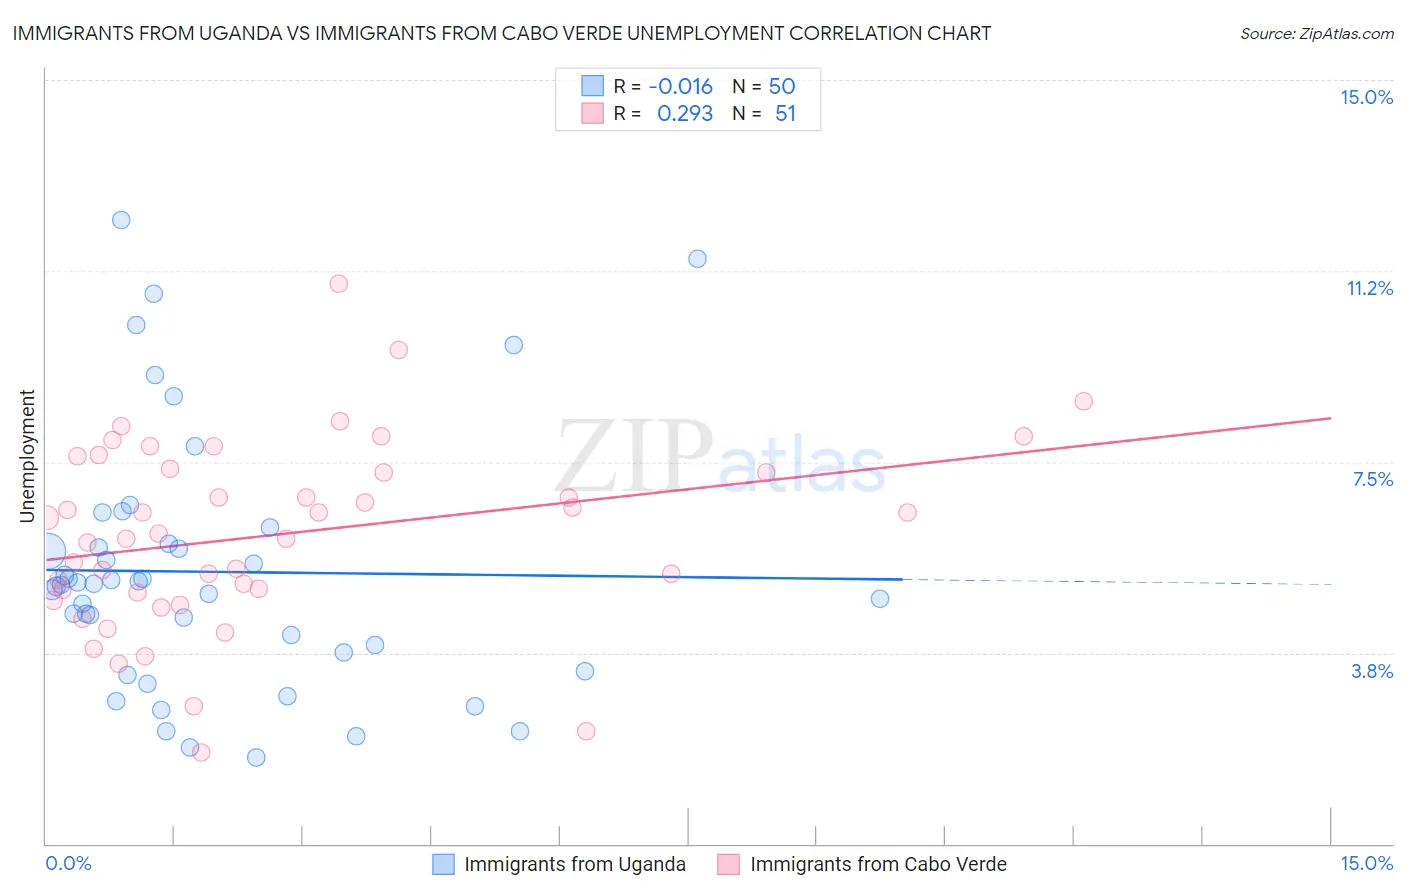
Immigrants from Uganda vs Immigrants from Cabo Verde Unemployment Correlation Chart
The statistical analysis conducted on geographies consisting of 125,961,312 people shows no correlation between the proportion of Immigrants from Uganda and unemployment in the United States with a correlation coefficient (R) of -0.016 and weighted average of 5.3%. Similarly, the statistical analysis conducted on geographies consisting of 38,137,601 people shows a weak positive correlation between the proportion of Immigrants from Cabo Verde and unemployment in the United States with a correlation coefficient (R) of 0.293 and weighted average of 6.8%, a difference of 28.7%.
Unemployment Correlation Summary
| Measurement | Immigrants from Uganda | Immigrants from Cabo Verde |
| Minimum | 1.7% | 1.8% |
| Maximum | 12.2% | 11.0% |
| Range | 10.5% | 9.2% |
| Mean | 5.3% | 6.1% |
| Median | 5.1% | 6.1% |
| Interquartile 25% (IQ1) | 3.7% | 4.9% |
| Interquartile 75% (IQ3) | 5.9% | 7.4% |
| Interquartile Range (IQR) | 2.2% | 2.4% |
| Standard Deviation (Sample) | 2.5% | 1.8% |
| Standard Deviation (Population) | 2.5% | 1.8% |
Similar Demographics by Unemployment
Demographics Similar to Immigrants from Uganda by Unemployment
In terms of unemployment, the demographic groups most similar to Immigrants from Uganda are Costa Rican (5.3%, a difference of 0.030%), Alsatian (5.3%, a difference of 0.050%), Immigrants from Thailand (5.3%, a difference of 0.070%), Assyrian/Chaldean/Syriac (5.3%, a difference of 0.090%), and Brazilian (5.3%, a difference of 0.15%).
| Demographics | Rating | Rank | Unemployment |
| Malaysians | 46.8 /100 | #179 | Average 5.3% |
| Immigrants | Greece | 45.0 /100 | #180 | Average 5.3% |
| Albanians | 43.5 /100 | #181 | Average 5.3% |
| Spaniards | 42.2 /100 | #182 | Average 5.3% |
| Brazilians | 40.2 /100 | #183 | Average 5.3% |
| Assyrians/Chaldeans/Syriacs | 39.2 /100 | #184 | Fair 5.3% |
| Immigrants | Thailand | 38.9 /100 | #185 | Fair 5.3% |
| Immigrants | Uganda | 37.8 /100 | #186 | Fair 5.3% |
| Costa Ricans | 37.4 /100 | #187 | Fair 5.3% |
| Alsatians | 37.0 /100 | #188 | Fair 5.3% |
| Immigrants | Belarus | 35.6 /100 | #189 | Fair 5.3% |
| Arabs | 35.3 /100 | #190 | Fair 5.3% |
| Somalis | 34.0 /100 | #191 | Fair 5.3% |
| South Americans | 33.9 /100 | #192 | Fair 5.3% |
| Immigrants | Somalia | 33.8 /100 | #193 | Fair 5.3% |
Demographics Similar to Immigrants from Cabo Verde by Unemployment
In terms of unemployment, the demographic groups most similar to Immigrants from Cabo Verde are British West Indian (6.8%, a difference of 0.21%), Shoshone (6.8%, a difference of 0.60%), Immigrants from St. Vincent and the Grenadines (6.9%, a difference of 1.0%), Immigrants from Guyana (6.9%, a difference of 1.0%), and Guyanese (6.9%, a difference of 1.1%).
| Demographics | Rating | Rank | Unemployment |
| Cape Verdeans | 0.0 /100 | #311 | Tragic 6.5% |
| Colville | 0.0 /100 | #312 | Tragic 6.6% |
| Immigrants | Barbados | 0.0 /100 | #313 | Tragic 6.6% |
| Blacks/African Americans | 0.0 /100 | #314 | Tragic 6.6% |
| Houma | 0.0 /100 | #315 | Tragic 6.7% |
| Immigrants | Dominica | 0.0 /100 | #316 | Tragic 6.7% |
| Shoshone | 0.0 /100 | #317 | Tragic 6.8% |
| Immigrants | Cabo Verde | 0.0 /100 | #318 | Tragic 6.8% |
| British West Indians | 0.0 /100 | #319 | Tragic 6.8% |
| Immigrants | St. Vincent and the Grenadines | 0.0 /100 | #320 | Tragic 6.9% |
| Immigrants | Guyana | 0.0 /100 | #321 | Tragic 6.9% |
| Guyanese | 0.0 /100 | #322 | Tragic 6.9% |
| Immigrants | Grenada | 0.0 /100 | #323 | Tragic 6.9% |
| Immigrants | Armenia | 0.0 /100 | #324 | Tragic 7.0% |
| Natives/Alaskans | 0.0 /100 | #325 | Tragic 7.0% |