Yup'ik vs Immigrants from Cabo Verde Unemployment
COMPARE
Yup'ik
Immigrants from Cabo Verde
Unemployment
Unemployment Comparison
Yup'ik
Immigrants from Cabo Verde
13.6%
UNEMPLOYMENT
0.0/ 100
METRIC RATING
347th/ 347
METRIC RANK
6.8%
UNEMPLOYMENT
0.0/ 100
METRIC RATING
318th/ 347
METRIC RANK
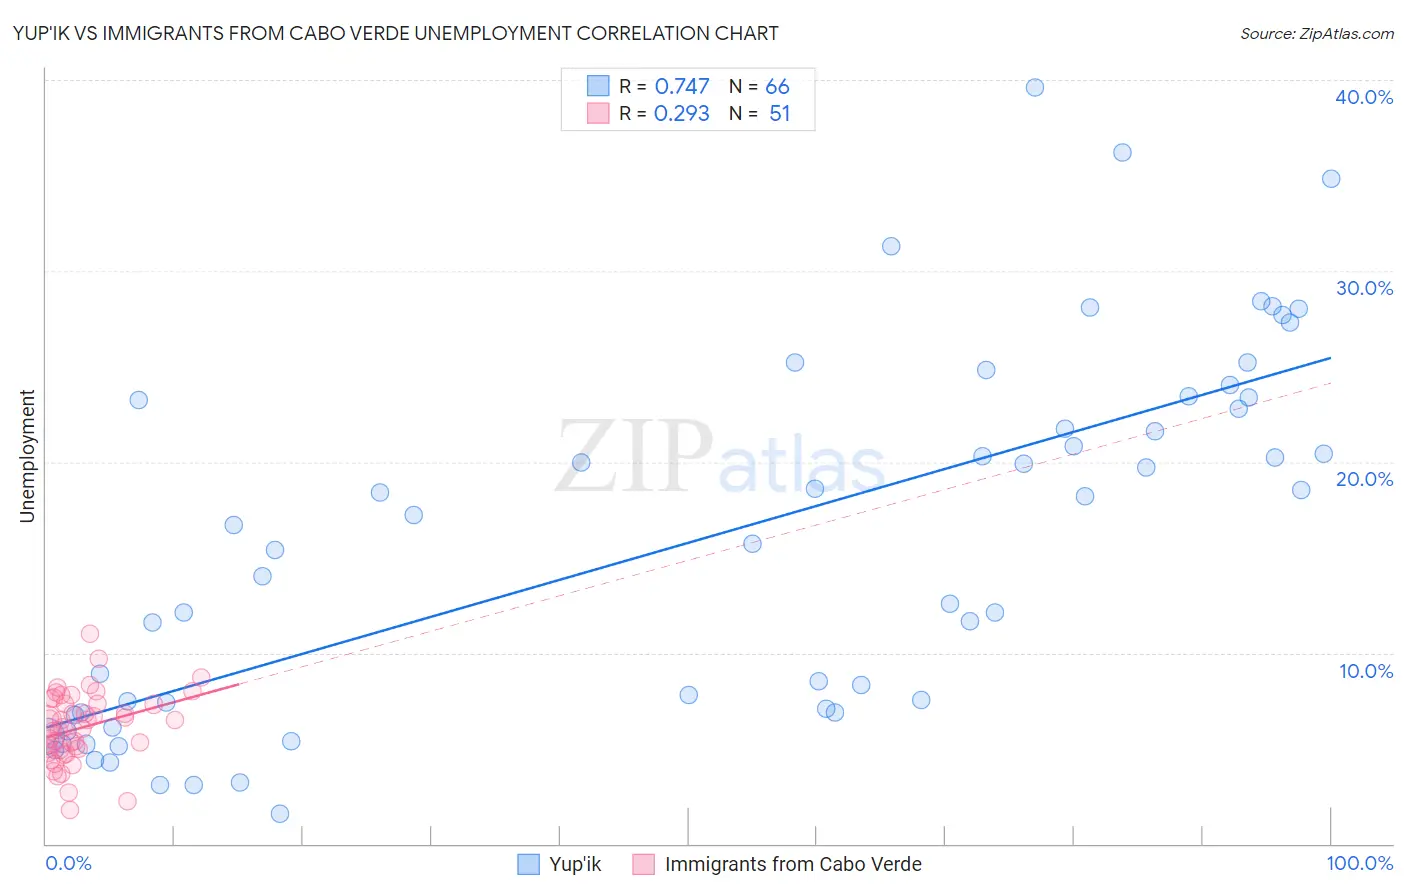
Yup'ik vs Immigrants from Cabo Verde Unemployment Correlation Chart
The statistical analysis conducted on geographies consisting of 39,958,223 people shows a strong positive correlation between the proportion of Yup'ik and unemployment in the United States with a correlation coefficient (R) of 0.747 and weighted average of 13.6%. Similarly, the statistical analysis conducted on geographies consisting of 38,137,601 people shows a weak positive correlation between the proportion of Immigrants from Cabo Verde and unemployment in the United States with a correlation coefficient (R) of 0.293 and weighted average of 6.8%, a difference of 100.0%.
Unemployment Correlation Summary
| Measurement | Yup'ik | Immigrants from Cabo Verde |
| Minimum | 1.6% | 1.8% |
| Maximum | 39.6% | 11.0% |
| Range | 38.0% | 9.2% |
| Mean | 15.8% | 6.1% |
| Median | 16.2% | 6.1% |
| Interquartile 25% (IQ1) | 6.9% | 4.9% |
| Interquartile 75% (IQ3) | 23.2% | 7.4% |
| Interquartile Range (IQR) | 16.3% | 2.4% |
| Standard Deviation (Sample) | 9.5% | 1.8% |
| Standard Deviation (Population) | 9.4% | 1.8% |
Similar Demographics by Unemployment
Demographics Similar to Yup'ik by Unemployment
In terms of unemployment, the demographic groups most similar to Yup'ik are Crow (11.1%, a difference of 23.3%), Inupiat (10.1%, a difference of 34.8%), Arapaho (9.8%, a difference of 38.8%), Yuman (9.1%, a difference of 50.4%), and Hopi (8.9%, a difference of 53.0%).
| Demographics | Rating | Rank | Unemployment |
| Immigrants | Dominican Republic | 0.0 /100 | #333 | Tragic 7.4% |
| Apache | 0.0 /100 | #334 | Tragic 7.4% |
| Alaskan Athabascans | 0.0 /100 | #335 | Tragic 7.7% |
| Immigrants | Yemen | 0.0 /100 | #336 | Tragic 7.7% |
| Cheyenne | 0.0 /100 | #337 | Tragic 8.0% |
| Pima | 0.0 /100 | #338 | Tragic 8.2% |
| Navajo | 0.0 /100 | #339 | Tragic 8.4% |
| Puerto Ricans | 0.0 /100 | #340 | Tragic 8.4% |
| Tohono O'odham | 0.0 /100 | #341 | Tragic 8.9% |
| Hopi | 0.0 /100 | #342 | Tragic 8.9% |
| Yuman | 0.0 /100 | #343 | Tragic 9.1% |
| Arapaho | 0.0 /100 | #344 | Tragic 9.8% |
| Inupiat | 0.0 /100 | #345 | Tragic 10.1% |
| Crow | 0.0 /100 | #346 | Tragic 11.1% |
| Yup'ik | 0.0 /100 | #347 | Tragic 13.6% |
Demographics Similar to Immigrants from Cabo Verde by Unemployment
In terms of unemployment, the demographic groups most similar to Immigrants from Cabo Verde are British West Indian (6.8%, a difference of 0.21%), Shoshone (6.8%, a difference of 0.60%), Immigrants from St. Vincent and the Grenadines (6.9%, a difference of 1.0%), Immigrants from Guyana (6.9%, a difference of 1.0%), and Guyanese (6.9%, a difference of 1.1%).
| Demographics | Rating | Rank | Unemployment |
| Cape Verdeans | 0.0 /100 | #311 | Tragic 6.5% |
| Colville | 0.0 /100 | #312 | Tragic 6.6% |
| Immigrants | Barbados | 0.0 /100 | #313 | Tragic 6.6% |
| Blacks/African Americans | 0.0 /100 | #314 | Tragic 6.6% |
| Houma | 0.0 /100 | #315 | Tragic 6.7% |
| Immigrants | Dominica | 0.0 /100 | #316 | Tragic 6.7% |
| Shoshone | 0.0 /100 | #317 | Tragic 6.8% |
| Immigrants | Cabo Verde | 0.0 /100 | #318 | Tragic 6.8% |
| British West Indians | 0.0 /100 | #319 | Tragic 6.8% |
| Immigrants | St. Vincent and the Grenadines | 0.0 /100 | #320 | Tragic 6.9% |
| Immigrants | Guyana | 0.0 /100 | #321 | Tragic 6.9% |
| Guyanese | 0.0 /100 | #322 | Tragic 6.9% |
| Immigrants | Grenada | 0.0 /100 | #323 | Tragic 6.9% |
| Immigrants | Armenia | 0.0 /100 | #324 | Tragic 7.0% |
| Natives/Alaskans | 0.0 /100 | #325 | Tragic 7.0% |