Asian vs Immigrants from Cabo Verde Unemployment
COMPARE
Asian
Immigrants from Cabo Verde
Unemployment
Unemployment Comparison
Asians
Immigrants from Cabo Verde
5.1%
UNEMPLOYMENT
89.0/ 100
METRIC RATING
123rd/ 347
METRIC RANK
6.8%
UNEMPLOYMENT
0.0/ 100
METRIC RATING
318th/ 347
METRIC RANK
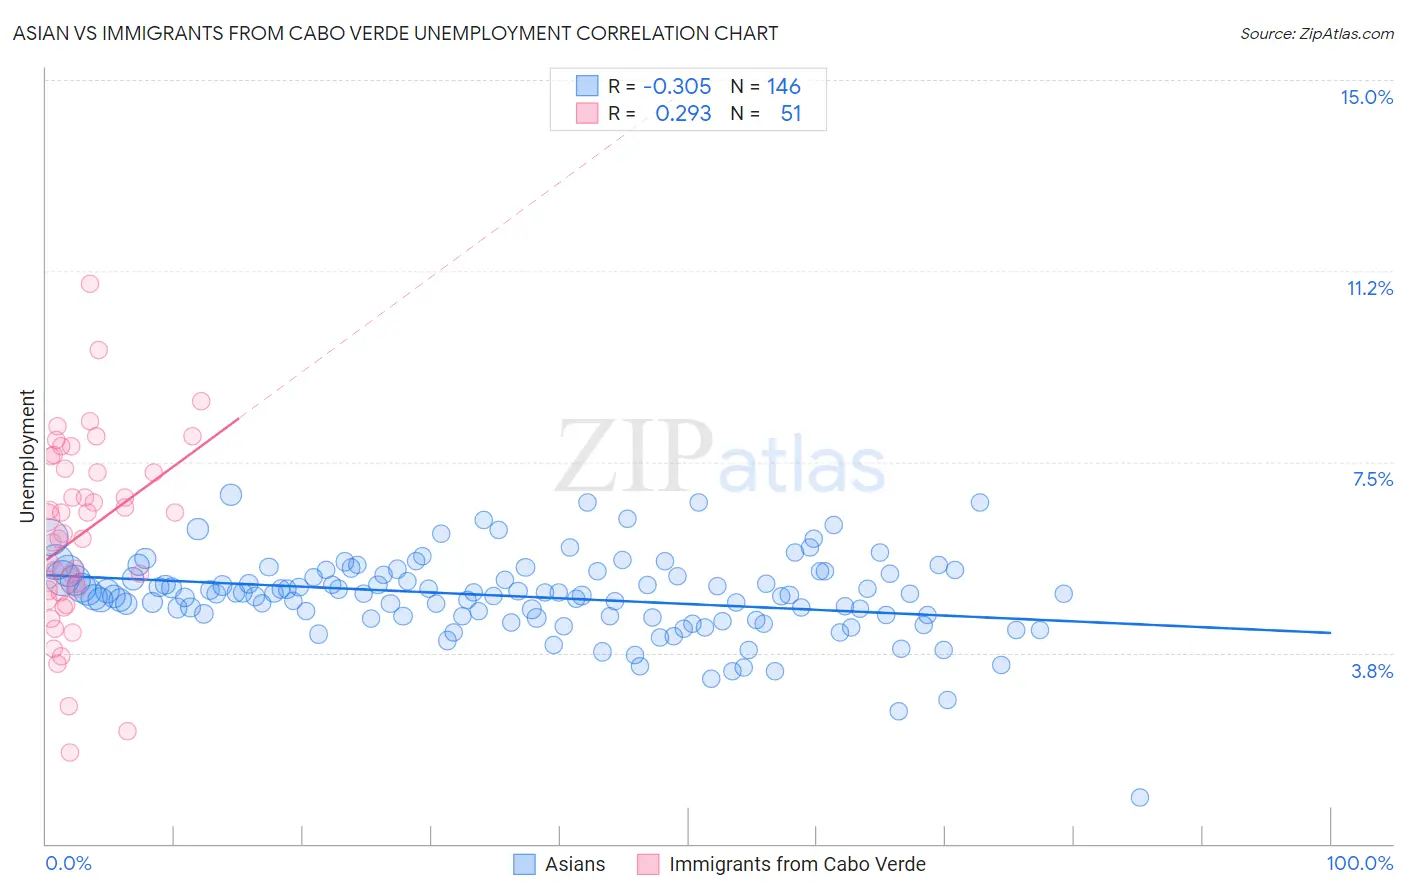
Asian vs Immigrants from Cabo Verde Unemployment Correlation Chart
The statistical analysis conducted on geographies consisting of 548,726,381 people shows a mild negative correlation between the proportion of Asians and unemployment in the United States with a correlation coefficient (R) of -0.305 and weighted average of 5.1%. Similarly, the statistical analysis conducted on geographies consisting of 38,137,601 people shows a weak positive correlation between the proportion of Immigrants from Cabo Verde and unemployment in the United States with a correlation coefficient (R) of 0.293 and weighted average of 6.8%, a difference of 34.0%.
Unemployment Correlation Summary
| Measurement | Asian | Immigrants from Cabo Verde |
| Minimum | 0.90% | 1.8% |
| Maximum | 6.9% | 11.0% |
| Range | 6.0% | 9.2% |
| Mean | 4.9% | 6.1% |
| Median | 4.9% | 6.1% |
| Interquartile 25% (IQ1) | 4.5% | 4.9% |
| Interquartile 75% (IQ3) | 5.3% | 7.4% |
| Interquartile Range (IQR) | 0.84% | 2.4% |
| Standard Deviation (Sample) | 0.81% | 1.8% |
| Standard Deviation (Population) | 0.81% | 1.8% |
Similar Demographics by Unemployment
Demographics Similar to Asians by Unemployment
In terms of unemployment, the demographic groups most similar to Asians are Immigrants from Switzerland (5.1%, a difference of 0.020%), Lebanese (5.1%, a difference of 0.040%), Ethiopian (5.1%, a difference of 0.050%), Immigrants from Eastern Asia (5.1%, a difference of 0.10%), and Macedonian (5.1%, a difference of 0.11%).
| Demographics | Rating | Rank | Unemployment |
| Immigrants | Sri Lanka | 91.1 /100 | #116 | Exceptional 5.1% |
| Immigrants | Malaysia | 91.0 /100 | #117 | Exceptional 5.1% |
| Immigrants | Germany | 90.8 /100 | #118 | Exceptional 5.1% |
| Immigrants | France | 89.7 /100 | #119 | Excellent 5.1% |
| Macedonians | 89.7 /100 | #120 | Excellent 5.1% |
| Lebanese | 89.2 /100 | #121 | Excellent 5.1% |
| Immigrants | Switzerland | 89.1 /100 | #122 | Excellent 5.1% |
| Asians | 89.0 /100 | #123 | Excellent 5.1% |
| Ethiopians | 88.6 /100 | #124 | Excellent 5.1% |
| Immigrants | Eastern Asia | 88.3 /100 | #125 | Excellent 5.1% |
| Kenyans | 88.2 /100 | #126 | Excellent 5.1% |
| Immigrants | Kenya | 88.2 /100 | #127 | Excellent 5.1% |
| Immigrants | Eastern Africa | 88.1 /100 | #128 | Excellent 5.1% |
| Immigrants | Latvia | 88.0 /100 | #129 | Excellent 5.1% |
| Iranians | 86.9 /100 | #130 | Excellent 5.1% |
Demographics Similar to Immigrants from Cabo Verde by Unemployment
In terms of unemployment, the demographic groups most similar to Immigrants from Cabo Verde are British West Indian (6.8%, a difference of 0.21%), Shoshone (6.8%, a difference of 0.60%), Immigrants from St. Vincent and the Grenadines (6.9%, a difference of 1.0%), Immigrants from Guyana (6.9%, a difference of 1.0%), and Guyanese (6.9%, a difference of 1.1%).
| Demographics | Rating | Rank | Unemployment |
| Cape Verdeans | 0.0 /100 | #311 | Tragic 6.5% |
| Colville | 0.0 /100 | #312 | Tragic 6.6% |
| Immigrants | Barbados | 0.0 /100 | #313 | Tragic 6.6% |
| Blacks/African Americans | 0.0 /100 | #314 | Tragic 6.6% |
| Houma | 0.0 /100 | #315 | Tragic 6.7% |
| Immigrants | Dominica | 0.0 /100 | #316 | Tragic 6.7% |
| Shoshone | 0.0 /100 | #317 | Tragic 6.8% |
| Immigrants | Cabo Verde | 0.0 /100 | #318 | Tragic 6.8% |
| British West Indians | 0.0 /100 | #319 | Tragic 6.8% |
| Immigrants | St. Vincent and the Grenadines | 0.0 /100 | #320 | Tragic 6.9% |
| Immigrants | Guyana | 0.0 /100 | #321 | Tragic 6.9% |
| Guyanese | 0.0 /100 | #322 | Tragic 6.9% |
| Immigrants | Grenada | 0.0 /100 | #323 | Tragic 6.9% |
| Immigrants | Armenia | 0.0 /100 | #324 | Tragic 7.0% |
| Natives/Alaskans | 0.0 /100 | #325 | Tragic 7.0% |