Immigrants from Uganda vs Pima Unemployment
COMPARE
Immigrants from Uganda
Pima
Unemployment
Unemployment Comparison
Immigrants from Uganda
Pima
5.3%
UNEMPLOYMENT
37.8/ 100
METRIC RATING
186th/ 347
METRIC RANK
8.2%
UNEMPLOYMENT
0.0/ 100
METRIC RATING
338th/ 347
METRIC RANK
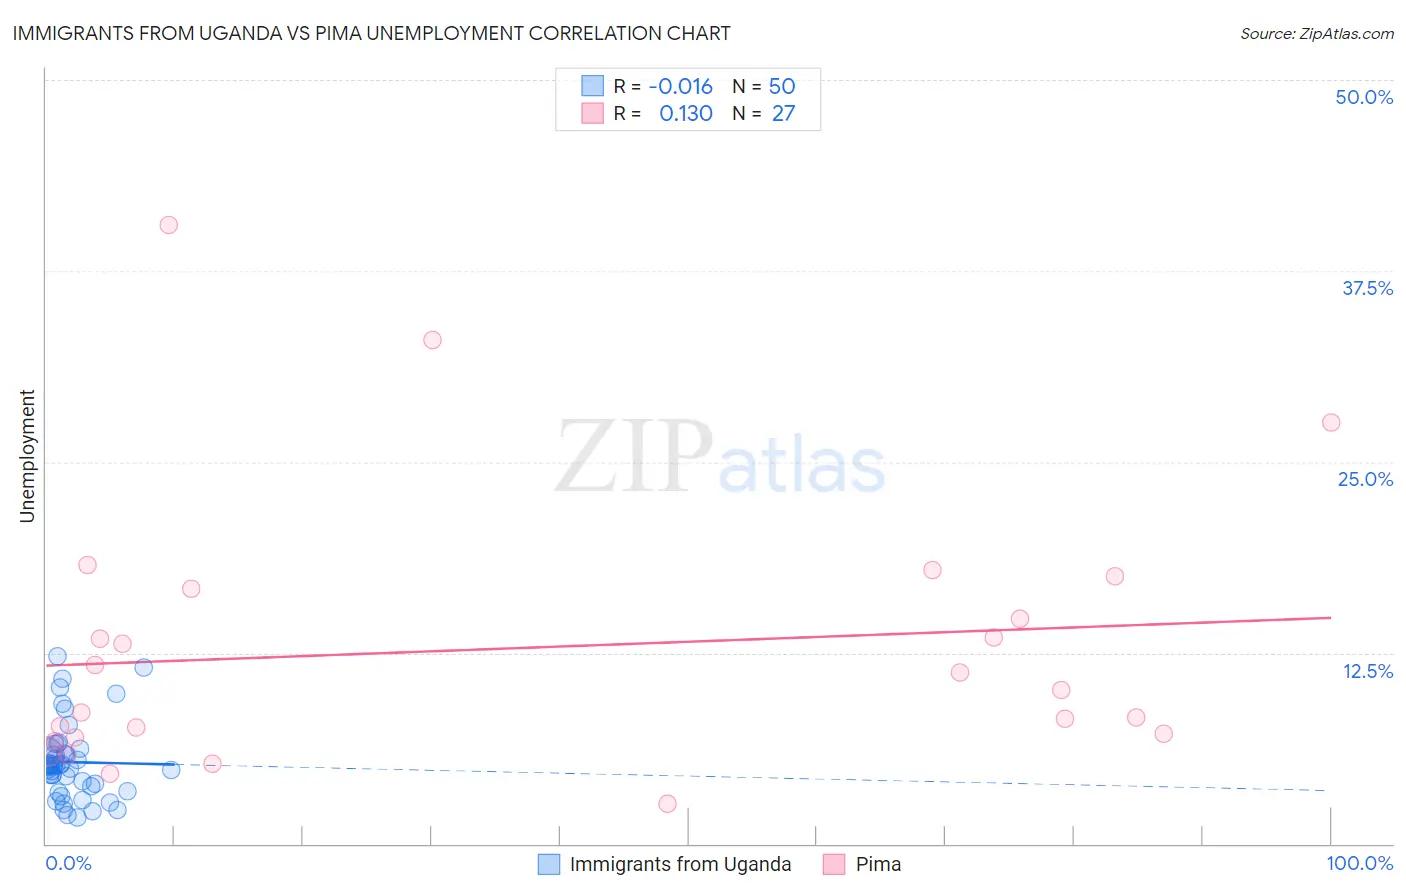
Immigrants from Uganda vs Pima Unemployment Correlation Chart
The statistical analysis conducted on geographies consisting of 125,961,312 people shows no correlation between the proportion of Immigrants from Uganda and unemployment in the United States with a correlation coefficient (R) of -0.016 and weighted average of 5.3%. Similarly, the statistical analysis conducted on geographies consisting of 61,529,497 people shows a poor positive correlation between the proportion of Pima and unemployment in the United States with a correlation coefficient (R) of 0.130 and weighted average of 8.2%, a difference of 55.2%.
Unemployment Correlation Summary
| Measurement | Immigrants from Uganda | Pima |
| Minimum | 1.7% | 2.6% |
| Maximum | 12.2% | 40.5% |
| Range | 10.5% | 37.9% |
| Mean | 5.3% | 12.8% |
| Median | 5.1% | 10.1% |
| Interquartile 25% (IQ1) | 3.7% | 6.9% |
| Interquartile 75% (IQ3) | 5.9% | 16.7% |
| Interquartile Range (IQR) | 2.2% | 9.8% |
| Standard Deviation (Sample) | 2.5% | 8.9% |
| Standard Deviation (Population) | 2.5% | 8.7% |
Similar Demographics by Unemployment
Demographics Similar to Immigrants from Uganda by Unemployment
In terms of unemployment, the demographic groups most similar to Immigrants from Uganda are Costa Rican (5.3%, a difference of 0.030%), Alsatian (5.3%, a difference of 0.050%), Immigrants from Thailand (5.3%, a difference of 0.070%), Assyrian/Chaldean/Syriac (5.3%, a difference of 0.090%), and Brazilian (5.3%, a difference of 0.15%).
| Demographics | Rating | Rank | Unemployment |
| Malaysians | 46.8 /100 | #179 | Average 5.3% |
| Immigrants | Greece | 45.0 /100 | #180 | Average 5.3% |
| Albanians | 43.5 /100 | #181 | Average 5.3% |
| Spaniards | 42.2 /100 | #182 | Average 5.3% |
| Brazilians | 40.2 /100 | #183 | Average 5.3% |
| Assyrians/Chaldeans/Syriacs | 39.2 /100 | #184 | Fair 5.3% |
| Immigrants | Thailand | 38.9 /100 | #185 | Fair 5.3% |
| Immigrants | Uganda | 37.8 /100 | #186 | Fair 5.3% |
| Costa Ricans | 37.4 /100 | #187 | Fair 5.3% |
| Alsatians | 37.0 /100 | #188 | Fair 5.3% |
| Immigrants | Belarus | 35.6 /100 | #189 | Fair 5.3% |
| Arabs | 35.3 /100 | #190 | Fair 5.3% |
| Somalis | 34.0 /100 | #191 | Fair 5.3% |
| South Americans | 33.9 /100 | #192 | Fair 5.3% |
| Immigrants | Somalia | 33.8 /100 | #193 | Fair 5.3% |
Demographics Similar to Pima by Unemployment
In terms of unemployment, the demographic groups most similar to Pima are Navajo (8.4%, a difference of 1.6%), Puerto Rican (8.4%, a difference of 2.4%), Cheyenne (8.0%, a difference of 2.8%), Immigrants from Yemen (7.7%, a difference of 6.7%), and Alaskan Athabascan (7.7%, a difference of 7.5%).
| Demographics | Rating | Rank | Unemployment |
| Dominicans | 0.0 /100 | #331 | Tragic 7.4% |
| Sioux | 0.0 /100 | #332 | Tragic 7.4% |
| Immigrants | Dominican Republic | 0.0 /100 | #333 | Tragic 7.4% |
| Apache | 0.0 /100 | #334 | Tragic 7.4% |
| Alaskan Athabascans | 0.0 /100 | #335 | Tragic 7.7% |
| Immigrants | Yemen | 0.0 /100 | #336 | Tragic 7.7% |
| Cheyenne | 0.0 /100 | #337 | Tragic 8.0% |
| Pima | 0.0 /100 | #338 | Tragic 8.2% |
| Navajo | 0.0 /100 | #339 | Tragic 8.4% |
| Puerto Ricans | 0.0 /100 | #340 | Tragic 8.4% |
| Tohono O'odham | 0.0 /100 | #341 | Tragic 8.9% |
| Hopi | 0.0 /100 | #342 | Tragic 8.9% |
| Yuman | 0.0 /100 | #343 | Tragic 9.1% |
| Arapaho | 0.0 /100 | #344 | Tragic 9.8% |
| Inupiat | 0.0 /100 | #345 | Tragic 10.1% |