Danish vs Immigrants from Cabo Verde Unemployment
COMPARE
Danish
Immigrants from Cabo Verde
Unemployment
Unemployment Comparison
Danes
Immigrants from Cabo Verde
4.3%
UNEMPLOYMENT
100.0/ 100
METRIC RATING
4th/ 347
METRIC RANK
6.8%
UNEMPLOYMENT
0.0/ 100
METRIC RATING
318th/ 347
METRIC RANK
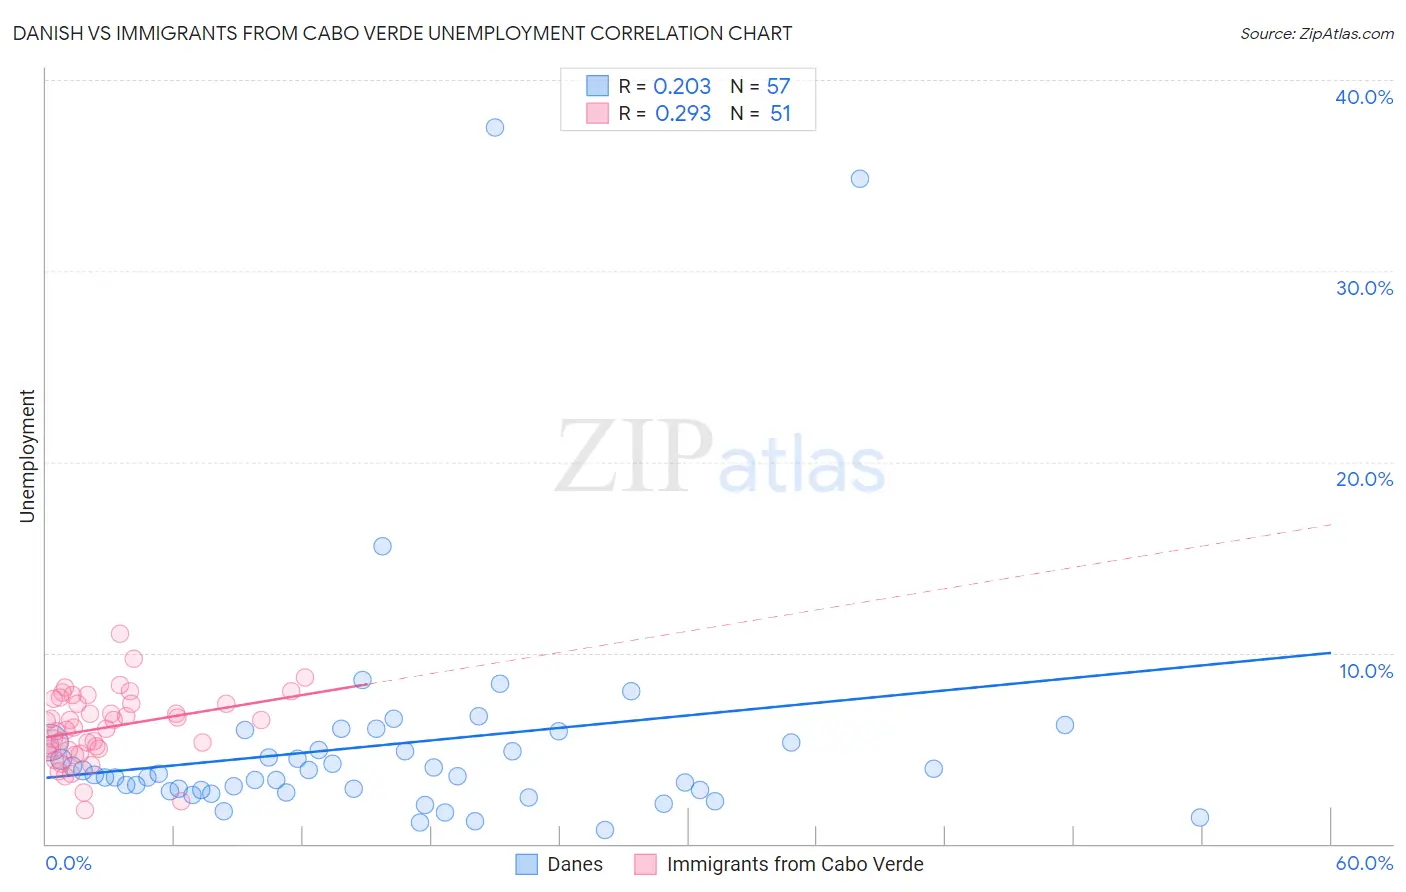
Danish vs Immigrants from Cabo Verde Unemployment Correlation Chart
The statistical analysis conducted on geographies consisting of 472,550,686 people shows a weak positive correlation between the proportion of Danes and unemployment in the United States with a correlation coefficient (R) of 0.203 and weighted average of 4.3%. Similarly, the statistical analysis conducted on geographies consisting of 38,137,601 people shows a weak positive correlation between the proportion of Immigrants from Cabo Verde and unemployment in the United States with a correlation coefficient (R) of 0.293 and weighted average of 6.8%, a difference of 56.8%.
Unemployment Correlation Summary
| Measurement | Danish | Immigrants from Cabo Verde |
| Minimum | 0.70% | 1.8% |
| Maximum | 37.5% | 11.0% |
| Range | 36.8% | 9.2% |
| Mean | 5.2% | 6.1% |
| Median | 3.6% | 6.1% |
| Interquartile 25% (IQ1) | 2.8% | 4.9% |
| Interquartile 75% (IQ3) | 5.3% | 7.4% |
| Interquartile Range (IQR) | 2.5% | 2.4% |
| Standard Deviation (Sample) | 6.4% | 1.8% |
| Standard Deviation (Population) | 6.3% | 1.8% |
Similar Demographics by Unemployment
Demographics Similar to Danes by Unemployment
In terms of unemployment, the demographic groups most similar to Danes are Czech (4.3%, a difference of 0.15%), Luxembourger (4.3%, a difference of 0.25%), Swedish (4.4%, a difference of 2.3%), German (4.5%, a difference of 3.1%), and Norwegian (4.2%, a difference of 3.6%).
| Demographics | Rating | Rank | Unemployment |
| Norwegians | 100.0 /100 | #1 | Exceptional 4.2% |
| Luxembourgers | 100.0 /100 | #2 | Exceptional 4.3% |
| Czechs | 100.0 /100 | #3 | Exceptional 4.3% |
| Danes | 100.0 /100 | #4 | Exceptional 4.3% |
| Swedes | 100.0 /100 | #5 | Exceptional 4.4% |
| Germans | 100.0 /100 | #6 | Exceptional 4.5% |
| Immigrants | India | 100.0 /100 | #7 | Exceptional 4.5% |
| Swiss | 100.0 /100 | #8 | Exceptional 4.5% |
| Scandinavians | 100.0 /100 | #9 | Exceptional 4.5% |
| Dutch | 100.0 /100 | #10 | Exceptional 4.6% |
| English | 100.0 /100 | #11 | Exceptional 4.6% |
| Pennsylvania Germans | 100.0 /100 | #12 | Exceptional 4.6% |
| Belgians | 100.0 /100 | #13 | Exceptional 4.6% |
| Immigrants | Cuba | 100.0 /100 | #14 | Exceptional 4.6% |
| Europeans | 99.9 /100 | #15 | Exceptional 4.6% |
Demographics Similar to Immigrants from Cabo Verde by Unemployment
In terms of unemployment, the demographic groups most similar to Immigrants from Cabo Verde are British West Indian (6.8%, a difference of 0.21%), Shoshone (6.8%, a difference of 0.60%), Immigrants from St. Vincent and the Grenadines (6.9%, a difference of 1.0%), Immigrants from Guyana (6.9%, a difference of 1.0%), and Guyanese (6.9%, a difference of 1.1%).
| Demographics | Rating | Rank | Unemployment |
| Cape Verdeans | 0.0 /100 | #311 | Tragic 6.5% |
| Colville | 0.0 /100 | #312 | Tragic 6.6% |
| Immigrants | Barbados | 0.0 /100 | #313 | Tragic 6.6% |
| Blacks/African Americans | 0.0 /100 | #314 | Tragic 6.6% |
| Houma | 0.0 /100 | #315 | Tragic 6.7% |
| Immigrants | Dominica | 0.0 /100 | #316 | Tragic 6.7% |
| Shoshone | 0.0 /100 | #317 | Tragic 6.8% |
| Immigrants | Cabo Verde | 0.0 /100 | #318 | Tragic 6.8% |
| British West Indians | 0.0 /100 | #319 | Tragic 6.8% |
| Immigrants | St. Vincent and the Grenadines | 0.0 /100 | #320 | Tragic 6.9% |
| Immigrants | Guyana | 0.0 /100 | #321 | Tragic 6.9% |
| Guyanese | 0.0 /100 | #322 | Tragic 6.9% |
| Immigrants | Grenada | 0.0 /100 | #323 | Tragic 6.9% |
| Immigrants | Armenia | 0.0 /100 | #324 | Tragic 7.0% |
| Natives/Alaskans | 0.0 /100 | #325 | Tragic 7.0% |