Immigrants from Syria vs Potawatomi Unemployment Among Women with Children Ages 6 to 17 years
COMPARE
Immigrants from Syria
Potawatomi
Unemployment Among Women with Children Ages 6 to 17 years
Unemployment Among Women with Children Ages 6 to 17 years Comparison
Immigrants from Syria
Potawatomi
9.1%
UNEMPLOYMENT AMONG WOMEN WITH CHILDREN AGES 6 TO 17 YEARS
29.7/ 100
METRIC RATING
188th/ 347
METRIC RANK
8.5%
UNEMPLOYMENT AMONG WOMEN WITH CHILDREN AGES 6 TO 17 YEARS
99.0/ 100
METRIC RATING
92nd/ 347
METRIC RANK
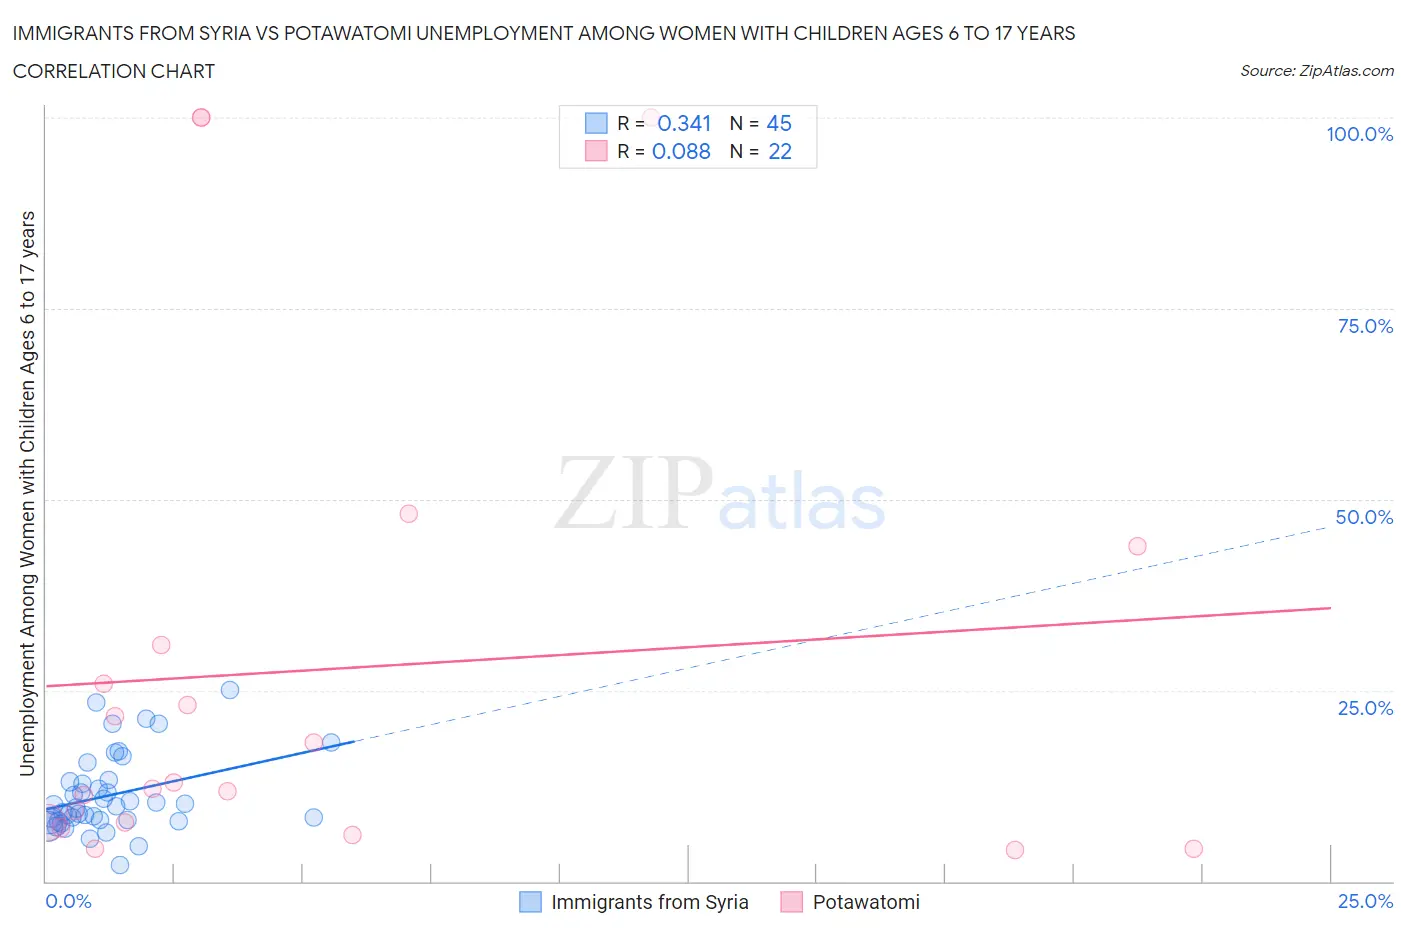
Immigrants from Syria vs Potawatomi Unemployment Among Women with Children Ages 6 to 17 years Correlation Chart
The statistical analysis conducted on geographies consisting of 145,483,764 people shows a mild positive correlation between the proportion of Immigrants from Syria and unemployment rate among women with children between the ages 6 and 17 in the United States with a correlation coefficient (R) of 0.341 and weighted average of 9.1%. Similarly, the statistical analysis conducted on geographies consisting of 100,614,314 people shows a slight positive correlation between the proportion of Potawatomi and unemployment rate among women with children between the ages 6 and 17 in the United States with a correlation coefficient (R) of 0.088 and weighted average of 8.5%, a difference of 6.4%.
Unemployment Among Women with Children Ages 6 to 17 years Correlation Summary
| Measurement | Immigrants from Syria | Potawatomi |
| Minimum | 2.2% | 4.1% |
| Maximum | 25.1% | 100.0% |
| Range | 22.9% | 95.9% |
| Mean | 11.3% | 27.7% |
| Median | 9.9% | 12.5% |
| Interquartile 25% (IQ1) | 8.0% | 7.7% |
| Interquartile 75% (IQ3) | 13.2% | 31.0% |
| Interquartile Range (IQR) | 5.2% | 23.3% |
| Standard Deviation (Sample) | 5.1% | 31.8% |
| Standard Deviation (Population) | 5.1% | 31.0% |
Similar Demographics by Unemployment Among Women with Children Ages 6 to 17 years
Demographics Similar to Immigrants from Syria by Unemployment Among Women with Children Ages 6 to 17 years
In terms of unemployment among women with children ages 6 to 17 years, the demographic groups most similar to Immigrants from Syria are Comanche (9.0%, a difference of 0.020%), Immigrants (9.1%, a difference of 0.030%), Slovene (9.1%, a difference of 0.070%), Belizean (9.1%, a difference of 0.070%), and Immigrants from Spain (9.0%, a difference of 0.14%).
| Demographics | Rating | Rank | Unemployment Among Women with Children Ages 6 to 17 years |
| Immigrants | Czechoslovakia | 34.5 /100 | #181 | Fair 9.0% |
| South American Indians | 34.4 /100 | #182 | Fair 9.0% |
| Swiss | 33.5 /100 | #183 | Fair 9.0% |
| Palestinians | 33.4 /100 | #184 | Fair 9.0% |
| Immigrants | Congo | 32.5 /100 | #185 | Fair 9.0% |
| Immigrants | Spain | 32.4 /100 | #186 | Fair 9.0% |
| Comanche | 30.0 /100 | #187 | Fair 9.0% |
| Immigrants | Syria | 29.7 /100 | #188 | Fair 9.1% |
| Immigrants | Immigrants | 29.2 /100 | #189 | Fair 9.1% |
| Slovenes | 28.5 /100 | #190 | Fair 9.1% |
| Belizeans | 28.4 /100 | #191 | Fair 9.1% |
| Guamanians/Chamorros | 27.2 /100 | #192 | Fair 9.1% |
| Immigrants | Turkey | 25.8 /100 | #193 | Fair 9.1% |
| Immigrants | Kazakhstan | 25.3 /100 | #194 | Fair 9.1% |
| Austrians | 25.0 /100 | #195 | Fair 9.1% |
Demographics Similar to Potawatomi by Unemployment Among Women with Children Ages 6 to 17 years
In terms of unemployment among women with children ages 6 to 17 years, the demographic groups most similar to Potawatomi are Immigrants from Eastern Europe (8.5%, a difference of 0.030%), Yugoslavian (8.5%, a difference of 0.090%), Australian (8.5%, a difference of 0.12%), Paiute (8.5%, a difference of 0.13%), and Immigrants from Vietnam (8.5%, a difference of 0.21%).
| Demographics | Rating | Rank | Unemployment Among Women with Children Ages 6 to 17 years |
| Immigrants | North Macedonia | 99.4 /100 | #85 | Exceptional 8.5% |
| Alaskan Athabascans | 99.4 /100 | #86 | Exceptional 8.5% |
| Immigrants | Israel | 99.1 /100 | #87 | Exceptional 8.5% |
| Immigrants | Vietnam | 99.1 /100 | #88 | Exceptional 8.5% |
| Paiute | 99.1 /100 | #89 | Exceptional 8.5% |
| Yugoslavians | 99.0 /100 | #90 | Exceptional 8.5% |
| Immigrants | Eastern Europe | 99.0 /100 | #91 | Exceptional 8.5% |
| Potawatomi | 99.0 /100 | #92 | Exceptional 8.5% |
| Australians | 98.9 /100 | #93 | Exceptional 8.5% |
| Immigrants | Barbados | 98.8 /100 | #94 | Exceptional 8.5% |
| Sri Lankans | 98.7 /100 | #95 | Exceptional 8.5% |
| German Russians | 98.6 /100 | #96 | Exceptional 8.5% |
| Bolivians | 98.5 /100 | #97 | Exceptional 8.5% |
| Malaysians | 98.5 /100 | #98 | Exceptional 8.6% |
| Immigrants | Lithuania | 98.4 /100 | #99 | Exceptional 8.6% |