Immigrants from Syria vs Immigrants from Denmark Unemployment Among Women with Children Ages 6 to 17 years
COMPARE
Immigrants from Syria
Immigrants from Denmark
Unemployment Among Women with Children Ages 6 to 17 years
Unemployment Among Women with Children Ages 6 to 17 years Comparison
Immigrants from Syria
Immigrants from Denmark
9.1%
UNEMPLOYMENT AMONG WOMEN WITH CHILDREN AGES 6 TO 17 YEARS
29.7/ 100
METRIC RATING
188th/ 347
METRIC RANK
8.7%
UNEMPLOYMENT AMONG WOMEN WITH CHILDREN AGES 6 TO 17 YEARS
95.5/ 100
METRIC RATING
121st/ 347
METRIC RANK
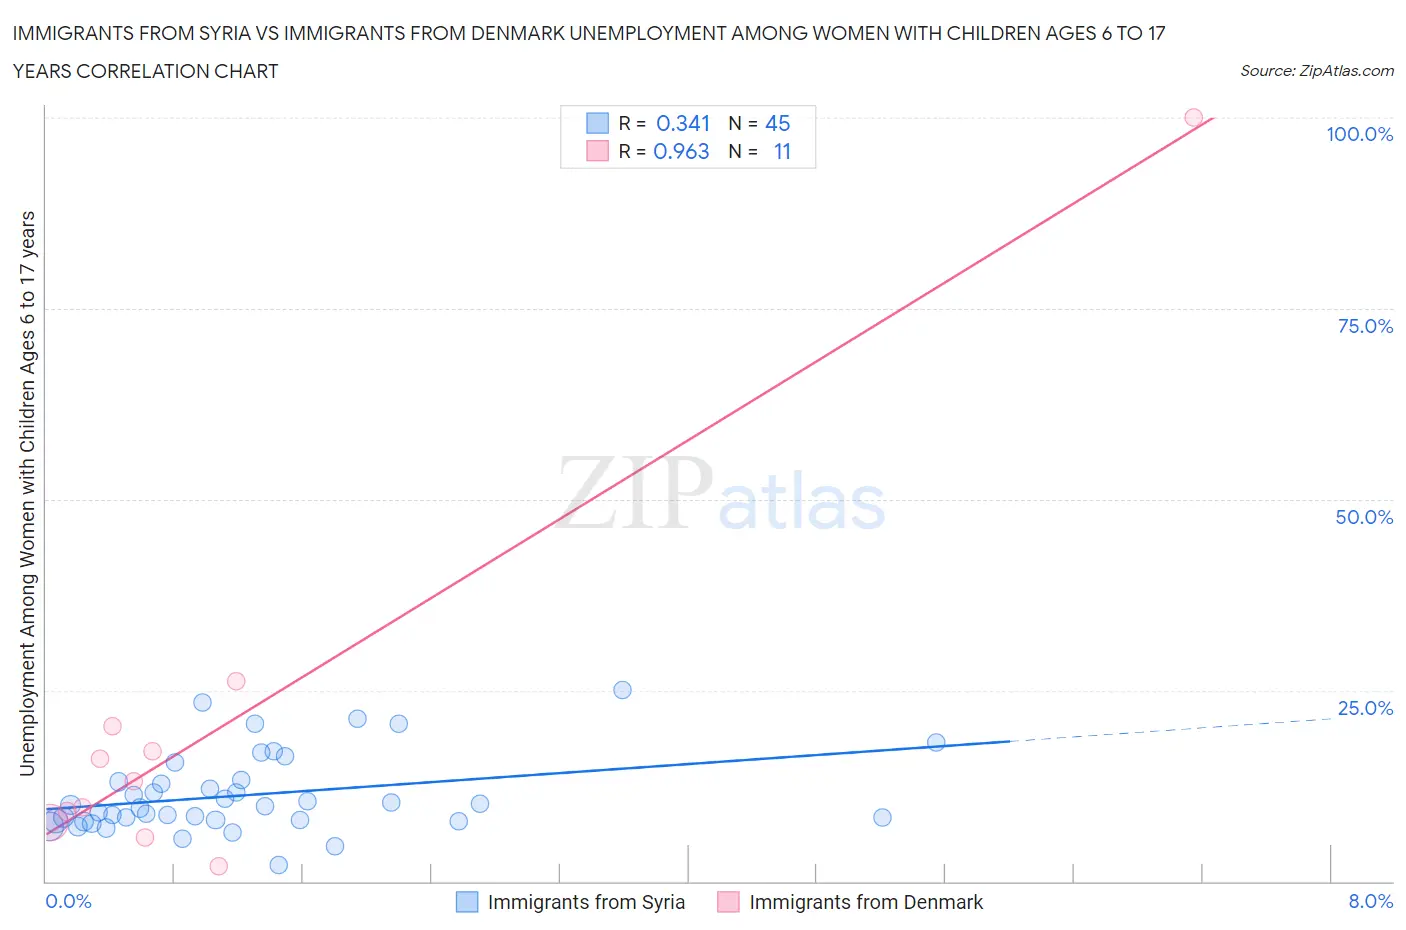
Immigrants from Syria vs Immigrants from Denmark Unemployment Among Women with Children Ages 6 to 17 years Correlation Chart
The statistical analysis conducted on geographies consisting of 145,483,764 people shows a mild positive correlation between the proportion of Immigrants from Syria and unemployment rate among women with children between the ages 6 and 17 in the United States with a correlation coefficient (R) of 0.341 and weighted average of 9.1%. Similarly, the statistical analysis conducted on geographies consisting of 113,144,957 people shows a perfect positive correlation between the proportion of Immigrants from Denmark and unemployment rate among women with children between the ages 6 and 17 in the United States with a correlation coefficient (R) of 0.963 and weighted average of 8.7%, a difference of 4.5%.
Unemployment Among Women with Children Ages 6 to 17 years Correlation Summary
| Measurement | Immigrants from Syria | Immigrants from Denmark |
| Minimum | 2.2% | 2.0% |
| Maximum | 25.1% | 100.0% |
| Range | 22.9% | 98.0% |
| Mean | 11.3% | 20.6% |
| Median | 9.9% | 13.1% |
| Interquartile 25% (IQ1) | 8.0% | 7.7% |
| Interquartile 75% (IQ3) | 13.2% | 20.3% |
| Interquartile Range (IQR) | 5.2% | 12.6% |
| Standard Deviation (Sample) | 5.1% | 27.2% |
| Standard Deviation (Population) | 5.1% | 26.0% |
Similar Demographics by Unemployment Among Women with Children Ages 6 to 17 years
Demographics Similar to Immigrants from Syria by Unemployment Among Women with Children Ages 6 to 17 years
In terms of unemployment among women with children ages 6 to 17 years, the demographic groups most similar to Immigrants from Syria are Comanche (9.0%, a difference of 0.020%), Immigrants (9.1%, a difference of 0.030%), Slovene (9.1%, a difference of 0.070%), Belizean (9.1%, a difference of 0.070%), and Immigrants from Spain (9.0%, a difference of 0.14%).
| Demographics | Rating | Rank | Unemployment Among Women with Children Ages 6 to 17 years |
| Immigrants | Czechoslovakia | 34.5 /100 | #181 | Fair 9.0% |
| South American Indians | 34.4 /100 | #182 | Fair 9.0% |
| Swiss | 33.5 /100 | #183 | Fair 9.0% |
| Palestinians | 33.4 /100 | #184 | Fair 9.0% |
| Immigrants | Congo | 32.5 /100 | #185 | Fair 9.0% |
| Immigrants | Spain | 32.4 /100 | #186 | Fair 9.0% |
| Comanche | 30.0 /100 | #187 | Fair 9.0% |
| Immigrants | Syria | 29.7 /100 | #188 | Fair 9.1% |
| Immigrants | Immigrants | 29.2 /100 | #189 | Fair 9.1% |
| Slovenes | 28.5 /100 | #190 | Fair 9.1% |
| Belizeans | 28.4 /100 | #191 | Fair 9.1% |
| Guamanians/Chamorros | 27.2 /100 | #192 | Fair 9.1% |
| Immigrants | Turkey | 25.8 /100 | #193 | Fair 9.1% |
| Immigrants | Kazakhstan | 25.3 /100 | #194 | Fair 9.1% |
| Austrians | 25.0 /100 | #195 | Fair 9.1% |
Demographics Similar to Immigrants from Denmark by Unemployment Among Women with Children Ages 6 to 17 years
In terms of unemployment among women with children ages 6 to 17 years, the demographic groups most similar to Immigrants from Denmark are Israeli (8.7%, a difference of 0.11%), Immigrants from Egypt (8.7%, a difference of 0.12%), Immigrants from Morocco (8.7%, a difference of 0.16%), Immigrants from Lebanon (8.7%, a difference of 0.16%), and Immigrants from Grenada (8.6%, a difference of 0.19%).
| Demographics | Rating | Rank | Unemployment Among Women with Children Ages 6 to 17 years |
| Immigrants | Russia | 96.7 /100 | #114 | Exceptional 8.6% |
| Argentineans | 96.5 /100 | #115 | Exceptional 8.6% |
| Zimbabweans | 96.3 /100 | #116 | Exceptional 8.6% |
| Albanians | 96.3 /100 | #117 | Exceptional 8.6% |
| Pueblo | 96.2 /100 | #118 | Exceptional 8.6% |
| Immigrants | Grenada | 96.2 /100 | #119 | Exceptional 8.6% |
| Israelis | 95.9 /100 | #120 | Exceptional 8.7% |
| Immigrants | Denmark | 95.5 /100 | #121 | Exceptional 8.7% |
| Immigrants | Egypt | 95.0 /100 | #122 | Exceptional 8.7% |
| Immigrants | Morocco | 94.9 /100 | #123 | Exceptional 8.7% |
| Immigrants | Lebanon | 94.9 /100 | #124 | Exceptional 8.7% |
| South Africans | 94.6 /100 | #125 | Exceptional 8.7% |
| Immigrants | Northern Africa | 94.4 /100 | #126 | Exceptional 8.7% |
| Czechs | 94.4 /100 | #127 | Exceptional 8.7% |
| Hmong | 94.3 /100 | #128 | Exceptional 8.7% |