Immigrants from Syria vs Immigrants from Oceania Unemployment Among Women with Children Ages 6 to 17 years
COMPARE
Immigrants from Syria
Immigrants from Oceania
Unemployment Among Women with Children Ages 6 to 17 years
Unemployment Among Women with Children Ages 6 to 17 years Comparison
Immigrants from Syria
Immigrants from Oceania
9.1%
UNEMPLOYMENT AMONG WOMEN WITH CHILDREN AGES 6 TO 17 YEARS
29.7/ 100
METRIC RATING
188th/ 347
METRIC RANK
8.1%
UNEMPLOYMENT AMONG WOMEN WITH CHILDREN AGES 6 TO 17 YEARS
100.0/ 100
METRIC RATING
49th/ 347
METRIC RANK
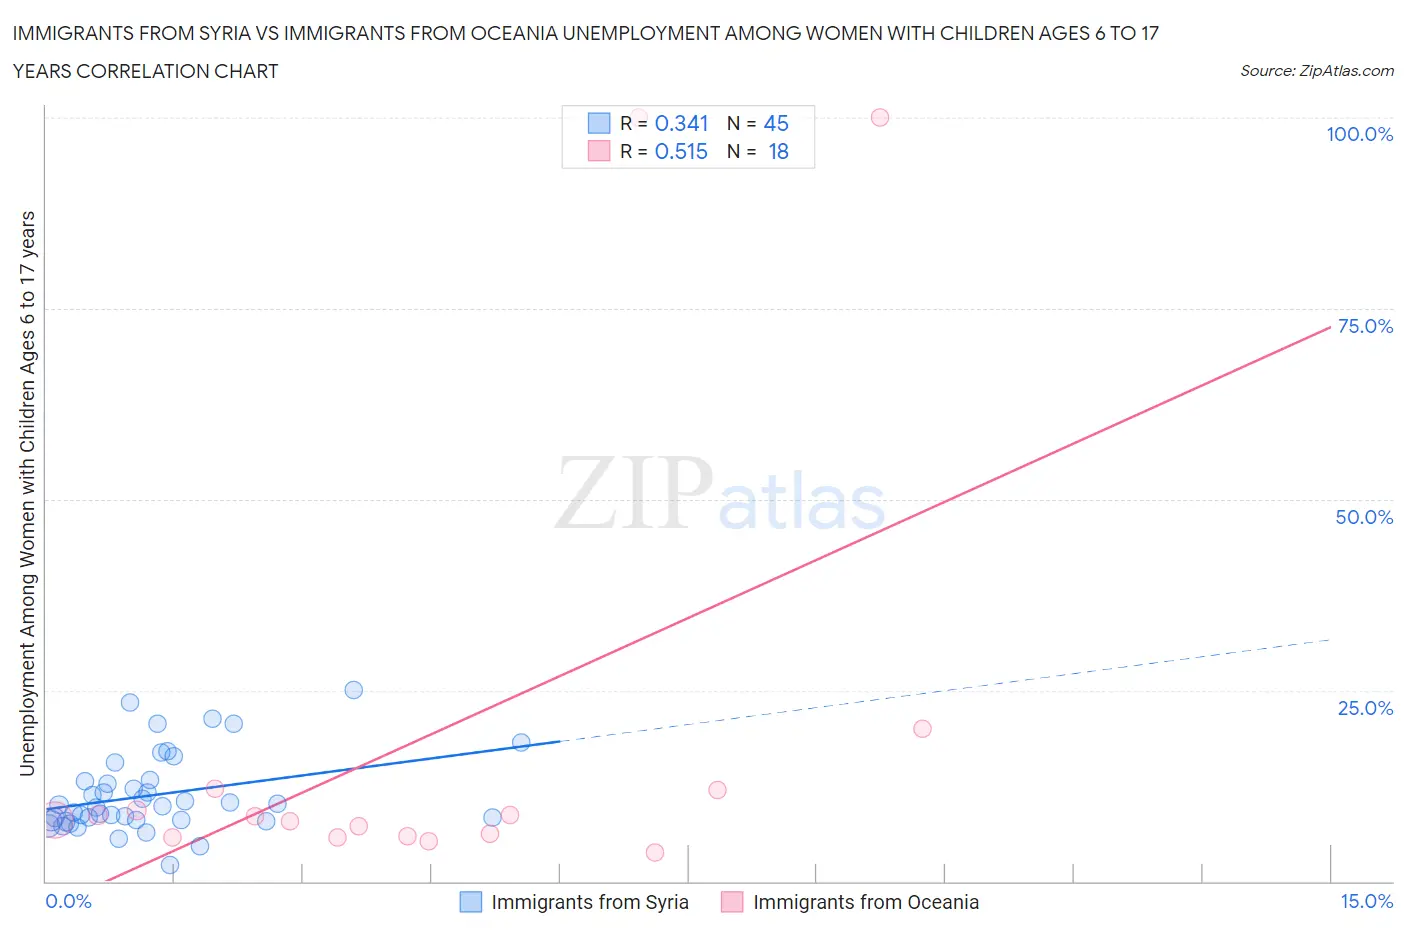
Immigrants from Syria vs Immigrants from Oceania Unemployment Among Women with Children Ages 6 to 17 years Correlation Chart
The statistical analysis conducted on geographies consisting of 145,483,764 people shows a mild positive correlation between the proportion of Immigrants from Syria and unemployment rate among women with children between the ages 6 and 17 in the United States with a correlation coefficient (R) of 0.341 and weighted average of 9.1%. Similarly, the statistical analysis conducted on geographies consisting of 229,741,233 people shows a substantial positive correlation between the proportion of Immigrants from Oceania and unemployment rate among women with children between the ages 6 and 17 in the United States with a correlation coefficient (R) of 0.515 and weighted average of 8.1%, a difference of 11.9%.
Unemployment Among Women with Children Ages 6 to 17 years Correlation Summary
| Measurement | Immigrants from Syria | Immigrants from Oceania |
| Minimum | 2.2% | 3.7% |
| Maximum | 25.1% | 100.0% |
| Range | 22.9% | 96.3% |
| Mean | 11.3% | 18.6% |
| Median | 9.9% | 8.3% |
| Interquartile 25% (IQ1) | 8.0% | 5.8% |
| Interquartile 75% (IQ3) | 13.2% | 12.0% |
| Interquartile Range (IQR) | 5.2% | 6.2% |
| Standard Deviation (Sample) | 5.1% | 29.8% |
| Standard Deviation (Population) | 5.1% | 29.0% |
Similar Demographics by Unemployment Among Women with Children Ages 6 to 17 years
Demographics Similar to Immigrants from Syria by Unemployment Among Women with Children Ages 6 to 17 years
In terms of unemployment among women with children ages 6 to 17 years, the demographic groups most similar to Immigrants from Syria are Comanche (9.0%, a difference of 0.020%), Immigrants (9.1%, a difference of 0.030%), Slovene (9.1%, a difference of 0.070%), Belizean (9.1%, a difference of 0.070%), and Immigrants from Spain (9.0%, a difference of 0.14%).
| Demographics | Rating | Rank | Unemployment Among Women with Children Ages 6 to 17 years |
| Immigrants | Czechoslovakia | 34.5 /100 | #181 | Fair 9.0% |
| South American Indians | 34.4 /100 | #182 | Fair 9.0% |
| Swiss | 33.5 /100 | #183 | Fair 9.0% |
| Palestinians | 33.4 /100 | #184 | Fair 9.0% |
| Immigrants | Congo | 32.5 /100 | #185 | Fair 9.0% |
| Immigrants | Spain | 32.4 /100 | #186 | Fair 9.0% |
| Comanche | 30.0 /100 | #187 | Fair 9.0% |
| Immigrants | Syria | 29.7 /100 | #188 | Fair 9.1% |
| Immigrants | Immigrants | 29.2 /100 | #189 | Fair 9.1% |
| Slovenes | 28.5 /100 | #190 | Fair 9.1% |
| Belizeans | 28.4 /100 | #191 | Fair 9.1% |
| Guamanians/Chamorros | 27.2 /100 | #192 | Fair 9.1% |
| Immigrants | Turkey | 25.8 /100 | #193 | Fair 9.1% |
| Immigrants | Kazakhstan | 25.3 /100 | #194 | Fair 9.1% |
| Austrians | 25.0 /100 | #195 | Fair 9.1% |
Demographics Similar to Immigrants from Oceania by Unemployment Among Women with Children Ages 6 to 17 years
In terms of unemployment among women with children ages 6 to 17 years, the demographic groups most similar to Immigrants from Oceania are Immigrants from Asia (8.1%, a difference of 0.060%), Hawaiian (8.1%, a difference of 0.11%), Immigrants from Switzerland (8.1%, a difference of 0.18%), Icelander (8.1%, a difference of 0.23%), and Immigrants from Bulgaria (8.1%, a difference of 0.24%).
| Demographics | Rating | Rank | Unemployment Among Women with Children Ages 6 to 17 years |
| Immigrants | Somalia | 100.0 /100 | #42 | Exceptional 8.0% |
| Bhutanese | 100.0 /100 | #43 | Exceptional 8.1% |
| Immigrants | Sweden | 100.0 /100 | #44 | Exceptional 8.1% |
| Immigrants | Bulgaria | 100.0 /100 | #45 | Exceptional 8.1% |
| Icelanders | 100.0 /100 | #46 | Exceptional 8.1% |
| Immigrants | Switzerland | 100.0 /100 | #47 | Exceptional 8.1% |
| Immigrants | Asia | 100.0 /100 | #48 | Exceptional 8.1% |
| Immigrants | Oceania | 100.0 /100 | #49 | Exceptional 8.1% |
| Hawaiians | 100.0 /100 | #50 | Exceptional 8.1% |
| Immigrants | Sudan | 100.0 /100 | #51 | Exceptional 8.1% |
| Immigrants | Iraq | 100.0 /100 | #52 | Exceptional 8.1% |
| Danes | 100.0 /100 | #53 | Exceptional 8.1% |
| Immigrants | Armenia | 100.0 /100 | #54 | Exceptional 8.2% |
| Immigrants | Japan | 100.0 /100 | #55 | Exceptional 8.2% |
| Immigrants | Bosnia and Herzegovina | 100.0 /100 | #56 | Exceptional 8.2% |