Immigrants from South Eastern Asia vs Puerto Rican Unemployment
COMPARE
Immigrants from South Eastern Asia
Puerto Rican
Unemployment
Unemployment Comparison
Immigrants from South Eastern Asia
Puerto Ricans
5.3%
UNEMPLOYMENT
27.0/ 100
METRIC RATING
201st/ 347
METRIC RANK
8.4%
UNEMPLOYMENT
0.0/ 100
METRIC RATING
340th/ 347
METRIC RANK
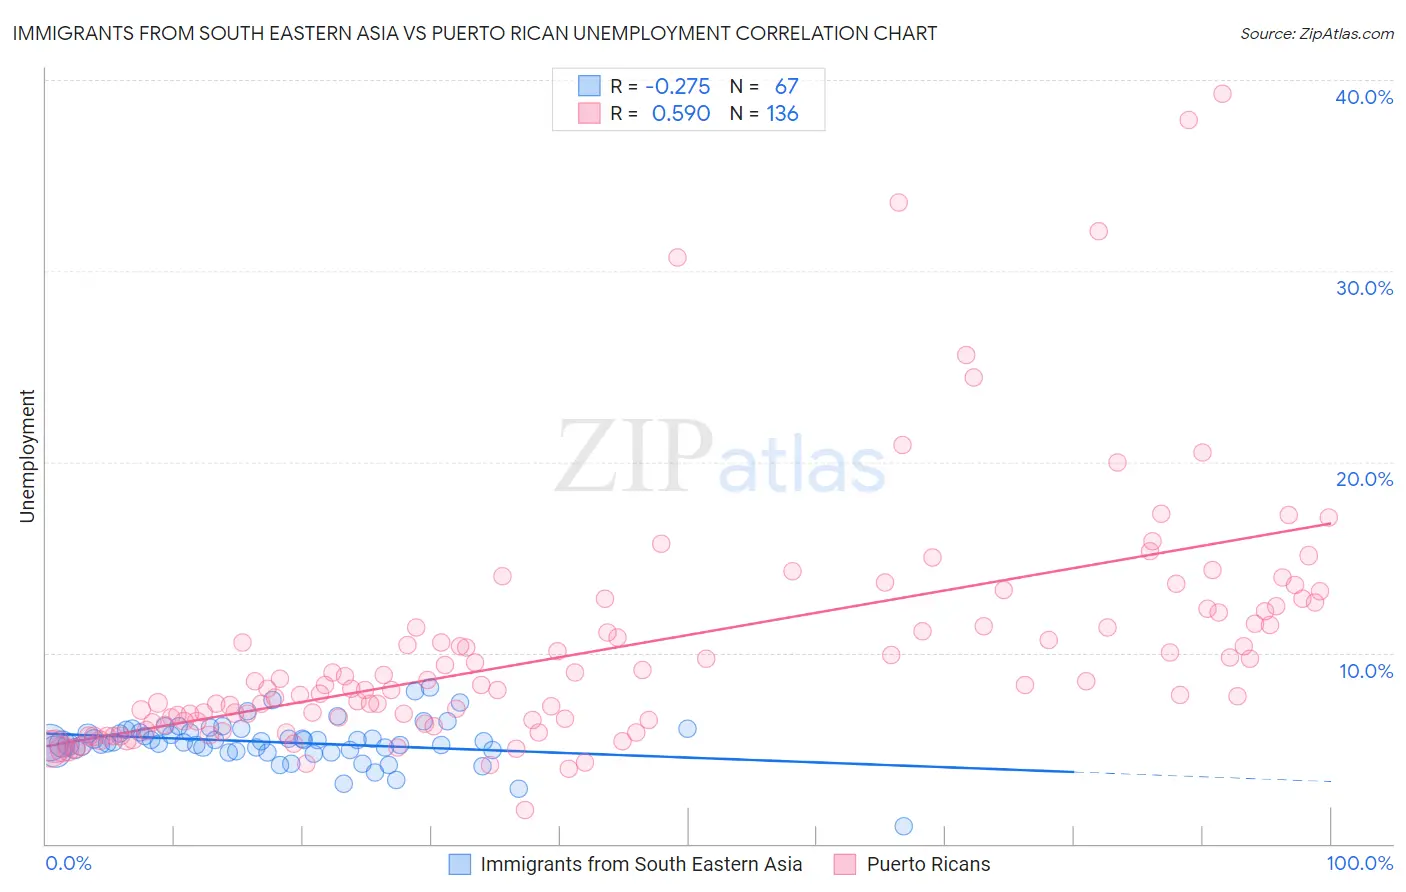
Immigrants from South Eastern Asia vs Puerto Rican Unemployment Correlation Chart
The statistical analysis conducted on geographies consisting of 511,484,497 people shows a weak negative correlation between the proportion of Immigrants from South Eastern Asia and unemployment in the United States with a correlation coefficient (R) of -0.275 and weighted average of 5.3%. Similarly, the statistical analysis conducted on geographies consisting of 526,845,718 people shows a substantial positive correlation between the proportion of Puerto Ricans and unemployment in the United States with a correlation coefficient (R) of 0.590 and weighted average of 8.4%, a difference of 57.7%.
Unemployment Correlation Summary
| Measurement | Immigrants from South Eastern Asia | Puerto Rican |
| Minimum | 0.90% | 1.8% |
| Maximum | 8.2% | 39.3% |
| Range | 7.3% | 37.5% |
| Mean | 5.3% | 10.2% |
| Median | 5.3% | 8.3% |
| Interquartile 25% (IQ1) | 4.9% | 6.4% |
| Interquartile 75% (IQ3) | 5.8% | 11.8% |
| Interquartile Range (IQR) | 0.92% | 5.4% |
| Standard Deviation (Sample) | 1.1% | 6.3% |
| Standard Deviation (Population) | 1.1% | 6.3% |
Similar Demographics by Unemployment
Demographics Similar to Immigrants from South Eastern Asia by Unemployment
In terms of unemployment, the demographic groups most similar to Immigrants from South Eastern Asia are Korean (5.3%, a difference of 0.030%), Immigrants from Israel (5.3%, a difference of 0.12%), Immigrants from Afghanistan (5.3%, a difference of 0.12%), Cherokee (5.3%, a difference of 0.12%), and Immigrants from Micronesia (5.3%, a difference of 0.14%).
| Demographics | Rating | Rank | Unemployment |
| Immigrants | Laos | 30.9 /100 | #194 | Fair 5.3% |
| Immigrants | Southern Europe | 30.9 /100 | #195 | Fair 5.3% |
| Peruvians | 29.9 /100 | #196 | Fair 5.3% |
| Immigrants | Uruguay | 29.8 /100 | #197 | Fair 5.3% |
| Immigrants | Israel | 28.6 /100 | #198 | Fair 5.3% |
| Immigrants | Afghanistan | 28.6 /100 | #199 | Fair 5.3% |
| Koreans | 27.4 /100 | #200 | Fair 5.3% |
| Immigrants | South Eastern Asia | 27.0 /100 | #201 | Fair 5.3% |
| Cherokee | 25.5 /100 | #202 | Fair 5.3% |
| Immigrants | Micronesia | 25.2 /100 | #203 | Fair 5.3% |
| Immigrants | Ukraine | 24.9 /100 | #204 | Fair 5.3% |
| Native Hawaiians | 24.1 /100 | #205 | Fair 5.3% |
| Immigrants | Peru | 22.7 /100 | #206 | Fair 5.4% |
| Creek | 19.4 /100 | #207 | Poor 5.4% |
| Portuguese | 19.0 /100 | #208 | Poor 5.4% |
Demographics Similar to Puerto Ricans by Unemployment
In terms of unemployment, the demographic groups most similar to Puerto Ricans are Navajo (8.4%, a difference of 0.79%), Pima (8.2%, a difference of 2.4%), Cheyenne (8.0%, a difference of 5.2%), Tohono O'odham (8.9%, a difference of 5.4%), and Hopi (8.9%, a difference of 5.9%).
| Demographics | Rating | Rank | Unemployment |
| Immigrants | Dominican Republic | 0.0 /100 | #333 | Tragic 7.4% |
| Apache | 0.0 /100 | #334 | Tragic 7.4% |
| Alaskan Athabascans | 0.0 /100 | #335 | Tragic 7.7% |
| Immigrants | Yemen | 0.0 /100 | #336 | Tragic 7.7% |
| Cheyenne | 0.0 /100 | #337 | Tragic 8.0% |
| Pima | 0.0 /100 | #338 | Tragic 8.2% |
| Navajo | 0.0 /100 | #339 | Tragic 8.4% |
| Puerto Ricans | 0.0 /100 | #340 | Tragic 8.4% |
| Tohono O'odham | 0.0 /100 | #341 | Tragic 8.9% |
| Hopi | 0.0 /100 | #342 | Tragic 8.9% |
| Yuman | 0.0 /100 | #343 | Tragic 9.1% |
| Arapaho | 0.0 /100 | #344 | Tragic 9.8% |
| Inupiat | 0.0 /100 | #345 | Tragic 10.1% |
| Crow | 0.0 /100 | #346 | Tragic 11.1% |
| Yup'ik | 0.0 /100 | #347 | Tragic 13.6% |