Immigrants from Portugal vs Immigrants from Belize Unemployment
COMPARE
Immigrants from Portugal
Immigrants from Belize
Unemployment
Unemployment Comparison
Immigrants from Portugal
Immigrants from Belize
5.7%
UNEMPLOYMENT
0.2/ 100
METRIC RATING
255th/ 347
METRIC RANK
6.5%
UNEMPLOYMENT
0.0/ 100
METRIC RATING
310th/ 347
METRIC RANK
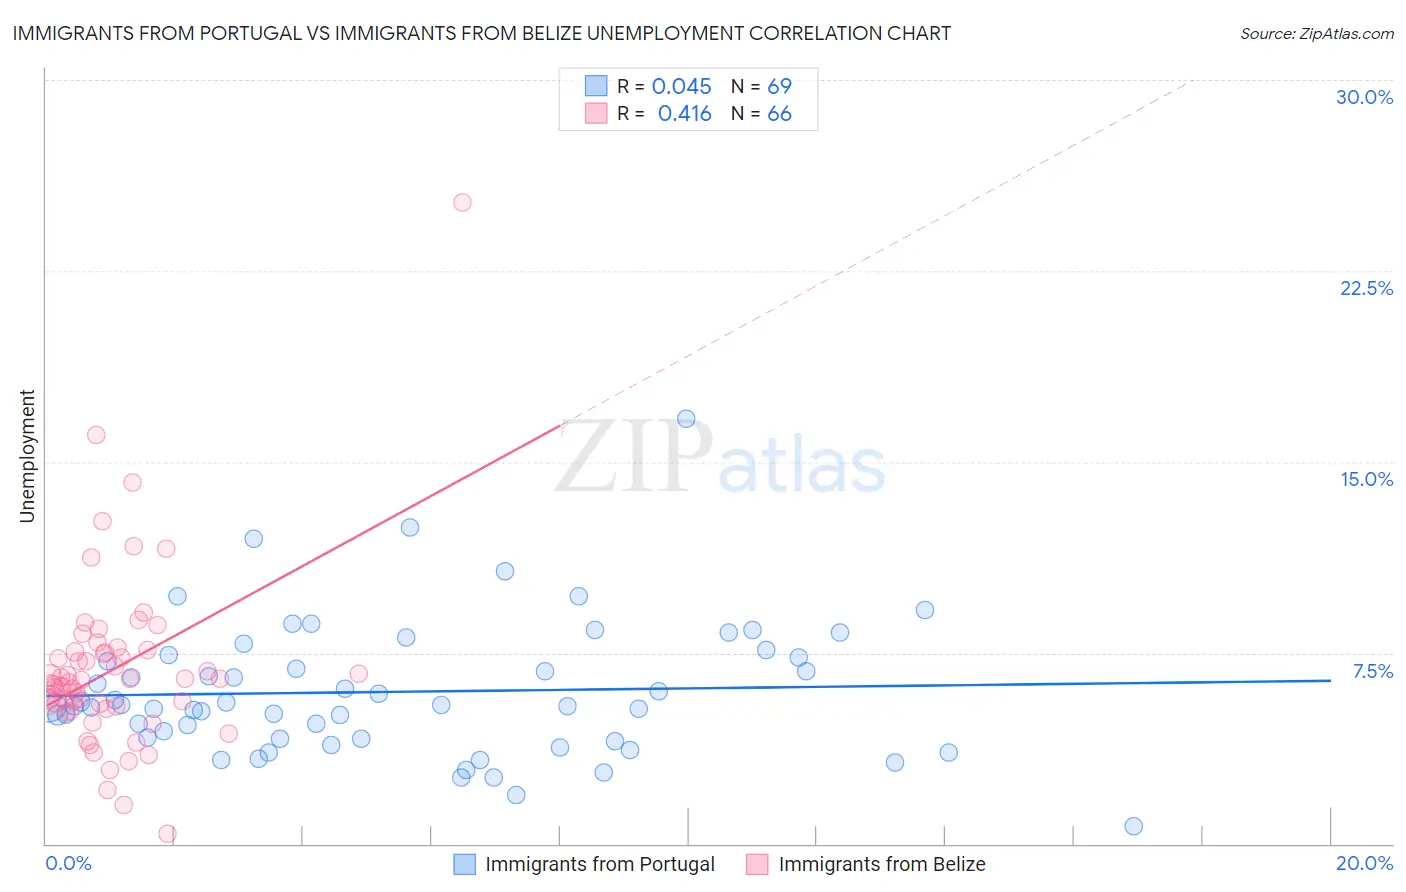
Immigrants from Portugal vs Immigrants from Belize Unemployment Correlation Chart
The statistical analysis conducted on geographies consisting of 174,742,748 people shows no correlation between the proportion of Immigrants from Portugal and unemployment in the United States with a correlation coefficient (R) of 0.045 and weighted average of 5.7%. Similarly, the statistical analysis conducted on geographies consisting of 130,280,852 people shows a moderate positive correlation between the proportion of Immigrants from Belize and unemployment in the United States with a correlation coefficient (R) of 0.416 and weighted average of 6.5%, a difference of 13.3%.
Unemployment Correlation Summary
| Measurement | Immigrants from Portugal | Immigrants from Belize |
| Minimum | 0.70% | 0.40% |
| Maximum | 16.7% | 25.2% |
| Range | 16.0% | 24.8% |
| Mean | 6.0% | 6.9% |
| Median | 5.4% | 6.4% |
| Interquartile 25% (IQ1) | 4.1% | 5.4% |
| Interquartile 75% (IQ3) | 7.4% | 7.5% |
| Interquartile Range (IQR) | 3.3% | 2.2% |
| Standard Deviation (Sample) | 2.7% | 3.5% |
| Standard Deviation (Population) | 2.6% | 3.5% |
Similar Demographics by Unemployment
Demographics Similar to Immigrants from Portugal by Unemployment
In terms of unemployment, the demographic groups most similar to Immigrants from Portugal are Guatemalan (5.8%, a difference of 0.21%), Immigrants from Honduras (5.7%, a difference of 0.44%), Yaqui (5.8%, a difference of 0.51%), Central American (5.7%, a difference of 0.52%), and Honduran (5.7%, a difference of 0.53%).
| Demographics | Rating | Rank | Unemployment |
| Liberians | 0.9 /100 | #248 | Tragic 5.6% |
| Cajuns | 0.8 /100 | #249 | Tragic 5.6% |
| Japanese | 0.8 /100 | #250 | Tragic 5.6% |
| Kiowa | 0.6 /100 | #251 | Tragic 5.7% |
| Hondurans | 0.3 /100 | #252 | Tragic 5.7% |
| Central Americans | 0.3 /100 | #253 | Tragic 5.7% |
| Immigrants | Honduras | 0.3 /100 | #254 | Tragic 5.7% |
| Immigrants | Portugal | 0.2 /100 | #255 | Tragic 5.7% |
| Guatemalans | 0.2 /100 | #256 | Tragic 5.8% |
| Yaqui | 0.2 /100 | #257 | Tragic 5.8% |
| Immigrants | Bahamas | 0.1 /100 | #258 | Tragic 5.8% |
| Sub-Saharan Africans | 0.1 /100 | #259 | Tragic 5.8% |
| Immigrants | Uzbekistan | 0.1 /100 | #260 | Tragic 5.8% |
| Immigrants | Guatemala | 0.1 /100 | #261 | Tragic 5.8% |
| Sierra Leoneans | 0.1 /100 | #262 | Tragic 5.8% |
Demographics Similar to Immigrants from Belize by Unemployment
In terms of unemployment, the demographic groups most similar to Immigrants from Belize are Vietnamese (6.5%, a difference of 0.27%), Barbadian (6.5%, a difference of 0.28%), Cape Verdean (6.5%, a difference of 0.33%), Immigrants from Bangladesh (6.5%, a difference of 0.65%), and Colville (6.6%, a difference of 0.91%).
| Demographics | Rating | Rank | Unemployment |
| Belizeans | 0.0 /100 | #303 | Tragic 6.4% |
| Immigrants | Jamaica | 0.0 /100 | #304 | Tragic 6.4% |
| Menominee | 0.0 /100 | #305 | Tragic 6.4% |
| Lumbee | 0.0 /100 | #306 | Tragic 6.4% |
| Immigrants | Bangladesh | 0.0 /100 | #307 | Tragic 6.5% |
| Barbadians | 0.0 /100 | #308 | Tragic 6.5% |
| Vietnamese | 0.0 /100 | #309 | Tragic 6.5% |
| Immigrants | Belize | 0.0 /100 | #310 | Tragic 6.5% |
| Cape Verdeans | 0.0 /100 | #311 | Tragic 6.5% |
| Colville | 0.0 /100 | #312 | Tragic 6.6% |
| Immigrants | Barbados | 0.0 /100 | #313 | Tragic 6.6% |
| Blacks/African Americans | 0.0 /100 | #314 | Tragic 6.6% |
| Houma | 0.0 /100 | #315 | Tragic 6.7% |
| Immigrants | Dominica | 0.0 /100 | #316 | Tragic 6.7% |
| Shoshone | 0.0 /100 | #317 | Tragic 6.8% |