Immigrants from Guatemala vs Immigrants from Belize Unemployment
COMPARE
Immigrants from Guatemala
Immigrants from Belize
Unemployment
Unemployment Comparison
Immigrants from Guatemala
Immigrants from Belize
5.8%
UNEMPLOYMENT
0.1/ 100
METRIC RATING
261st/ 347
METRIC RANK
6.5%
UNEMPLOYMENT
0.0/ 100
METRIC RATING
310th/ 347
METRIC RANK
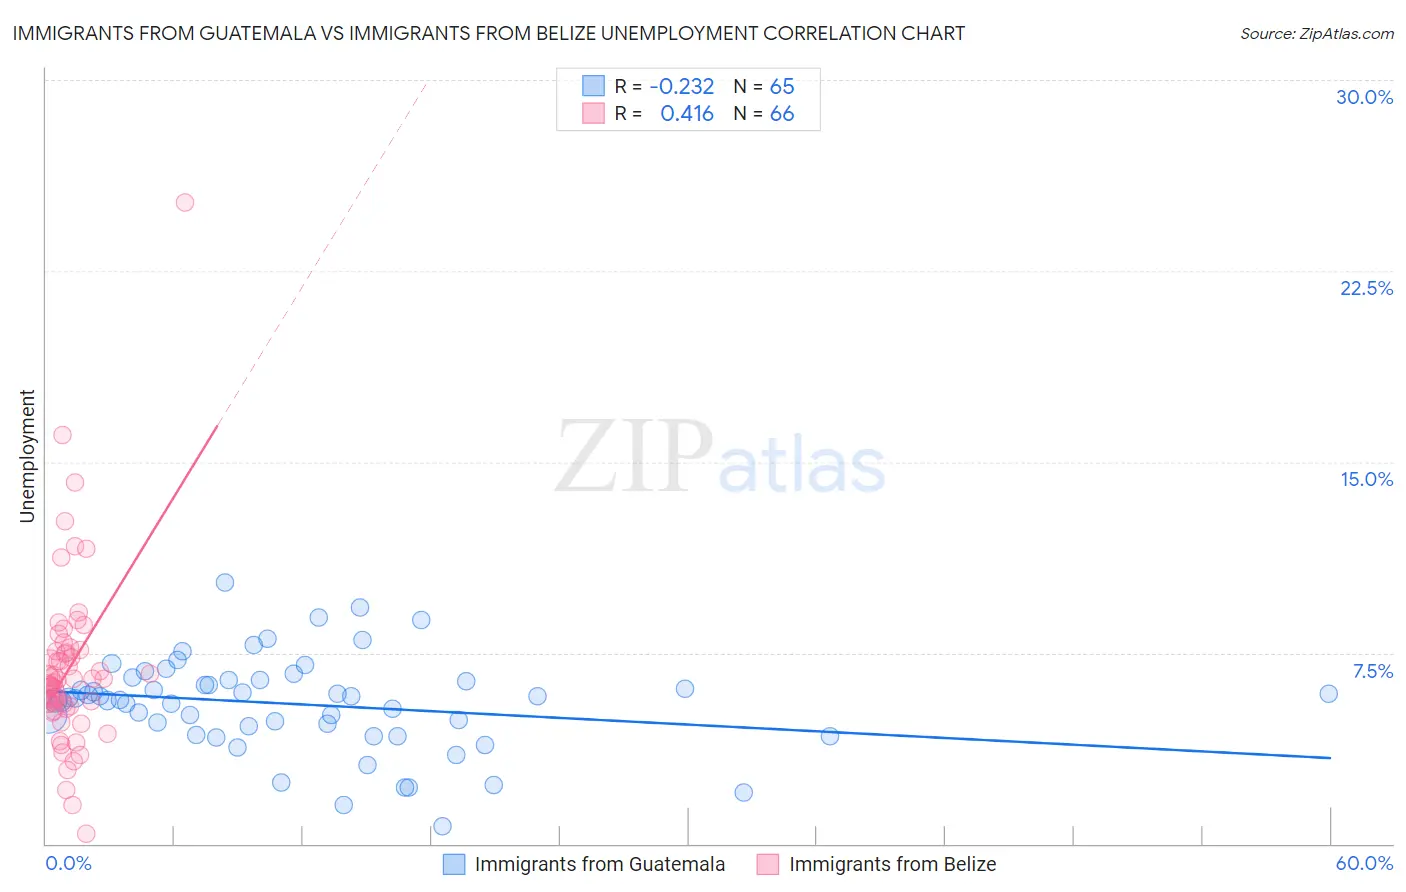
Immigrants from Guatemala vs Immigrants from Belize Unemployment Correlation Chart
The statistical analysis conducted on geographies consisting of 376,960,601 people shows a weak negative correlation between the proportion of Immigrants from Guatemala and unemployment in the United States with a correlation coefficient (R) of -0.232 and weighted average of 5.8%. Similarly, the statistical analysis conducted on geographies consisting of 130,280,852 people shows a moderate positive correlation between the proportion of Immigrants from Belize and unemployment in the United States with a correlation coefficient (R) of 0.416 and weighted average of 6.5%, a difference of 12.4%.
Unemployment Correlation Summary
| Measurement | Immigrants from Guatemala | Immigrants from Belize |
| Minimum | 0.70% | 0.40% |
| Maximum | 10.3% | 25.2% |
| Range | 9.6% | 24.8% |
| Mean | 5.5% | 6.9% |
| Median | 5.7% | 6.4% |
| Interquartile 25% (IQ1) | 4.4% | 5.4% |
| Interquartile 75% (IQ3) | 6.4% | 7.5% |
| Interquartile Range (IQR) | 2.0% | 2.2% |
| Standard Deviation (Sample) | 1.9% | 3.5% |
| Standard Deviation (Population) | 1.8% | 3.5% |
Similar Demographics by Unemployment
Demographics Similar to Immigrants from Guatemala by Unemployment
In terms of unemployment, the demographic groups most similar to Immigrants from Guatemala are Immigrants from Uzbekistan (5.8%, a difference of 0.020%), Subsaharan African (5.8%, a difference of 0.040%), Sierra Leonean (5.8%, a difference of 0.10%), Salvadoran (5.8%, a difference of 0.13%), and Immigrants from Bahamas (5.8%, a difference of 0.16%).
| Demographics | Rating | Rank | Unemployment |
| Immigrants | Honduras | 0.3 /100 | #254 | Tragic 5.7% |
| Immigrants | Portugal | 0.2 /100 | #255 | Tragic 5.7% |
| Guatemalans | 0.2 /100 | #256 | Tragic 5.8% |
| Yaqui | 0.2 /100 | #257 | Tragic 5.8% |
| Immigrants | Bahamas | 0.1 /100 | #258 | Tragic 5.8% |
| Sub-Saharan Africans | 0.1 /100 | #259 | Tragic 5.8% |
| Immigrants | Uzbekistan | 0.1 /100 | #260 | Tragic 5.8% |
| Immigrants | Guatemala | 0.1 /100 | #261 | Tragic 5.8% |
| Sierra Leoneans | 0.1 /100 | #262 | Tragic 5.8% |
| Salvadorans | 0.1 /100 | #263 | Tragic 5.8% |
| Immigrants | Liberia | 0.1 /100 | #264 | Tragic 5.8% |
| Nigerians | 0.1 /100 | #265 | Tragic 5.8% |
| Mexican American Indians | 0.1 /100 | #266 | Tragic 5.8% |
| Immigrants | Nigeria | 0.1 /100 | #267 | Tragic 5.8% |
| Immigrants | Sierra Leone | 0.1 /100 | #268 | Tragic 5.8% |
Demographics Similar to Immigrants from Belize by Unemployment
In terms of unemployment, the demographic groups most similar to Immigrants from Belize are Vietnamese (6.5%, a difference of 0.27%), Barbadian (6.5%, a difference of 0.28%), Cape Verdean (6.5%, a difference of 0.33%), Immigrants from Bangladesh (6.5%, a difference of 0.65%), and Colville (6.6%, a difference of 0.91%).
| Demographics | Rating | Rank | Unemployment |
| Belizeans | 0.0 /100 | #303 | Tragic 6.4% |
| Immigrants | Jamaica | 0.0 /100 | #304 | Tragic 6.4% |
| Menominee | 0.0 /100 | #305 | Tragic 6.4% |
| Lumbee | 0.0 /100 | #306 | Tragic 6.4% |
| Immigrants | Bangladesh | 0.0 /100 | #307 | Tragic 6.5% |
| Barbadians | 0.0 /100 | #308 | Tragic 6.5% |
| Vietnamese | 0.0 /100 | #309 | Tragic 6.5% |
| Immigrants | Belize | 0.0 /100 | #310 | Tragic 6.5% |
| Cape Verdeans | 0.0 /100 | #311 | Tragic 6.5% |
| Colville | 0.0 /100 | #312 | Tragic 6.6% |
| Immigrants | Barbados | 0.0 /100 | #313 | Tragic 6.6% |
| Blacks/African Americans | 0.0 /100 | #314 | Tragic 6.6% |
| Houma | 0.0 /100 | #315 | Tragic 6.7% |
| Immigrants | Dominica | 0.0 /100 | #316 | Tragic 6.7% |
| Shoshone | 0.0 /100 | #317 | Tragic 6.8% |