Immigrants from Portugal vs Immigrants from Northern Africa Unemployment
COMPARE
Immigrants from Portugal
Immigrants from Northern Africa
Unemployment
Unemployment Comparison
Immigrants from Portugal
Immigrants from Northern Africa
5.7%
UNEMPLOYMENT
0.2/ 100
METRIC RATING
255th/ 347
METRIC RANK
5.2%
UNEMPLOYMENT
71.3/ 100
METRIC RATING
155th/ 347
METRIC RANK
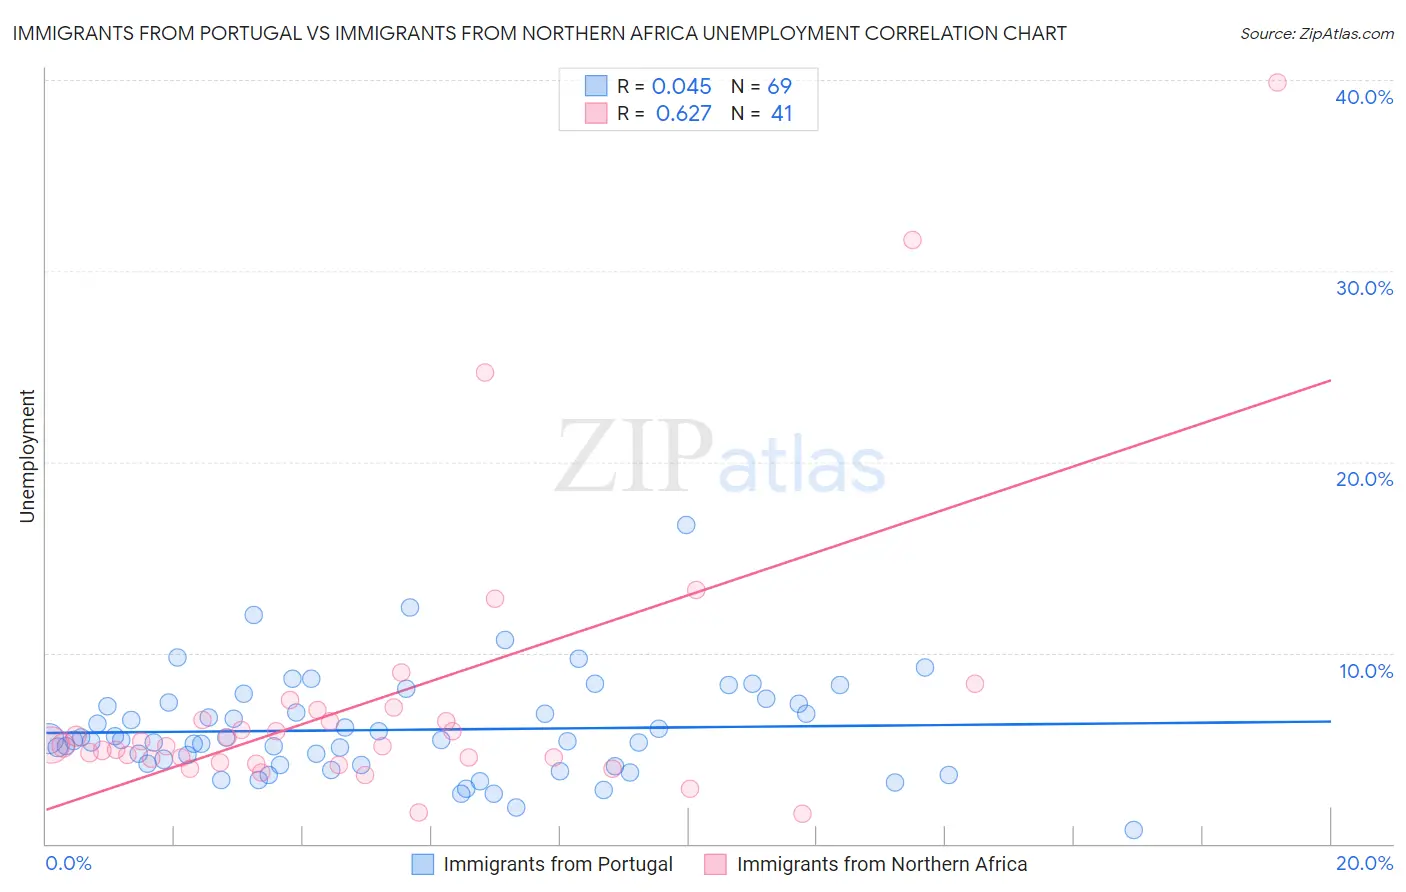
Immigrants from Portugal vs Immigrants from Northern Africa Unemployment Correlation Chart
The statistical analysis conducted on geographies consisting of 174,742,748 people shows no correlation between the proportion of Immigrants from Portugal and unemployment in the United States with a correlation coefficient (R) of 0.045 and weighted average of 5.7%. Similarly, the statistical analysis conducted on geographies consisting of 321,091,849 people shows a significant positive correlation between the proportion of Immigrants from Northern Africa and unemployment in the United States with a correlation coefficient (R) of 0.627 and weighted average of 5.2%, a difference of 10.9%.
Unemployment Correlation Summary
| Measurement | Immigrants from Portugal | Immigrants from Northern Africa |
| Minimum | 0.70% | 1.6% |
| Maximum | 16.7% | 39.9% |
| Range | 16.0% | 38.3% |
| Mean | 6.0% | 7.5% |
| Median | 5.4% | 5.2% |
| Interquartile 25% (IQ1) | 4.1% | 4.4% |
| Interquartile 75% (IQ3) | 7.4% | 6.7% |
| Interquartile Range (IQR) | 3.3% | 2.4% |
| Standard Deviation (Sample) | 2.7% | 7.5% |
| Standard Deviation (Population) | 2.6% | 7.5% |
Similar Demographics by Unemployment
Demographics Similar to Immigrants from Portugal by Unemployment
In terms of unemployment, the demographic groups most similar to Immigrants from Portugal are Guatemalan (5.8%, a difference of 0.21%), Immigrants from Honduras (5.7%, a difference of 0.44%), Yaqui (5.8%, a difference of 0.51%), Central American (5.7%, a difference of 0.52%), and Honduran (5.7%, a difference of 0.53%).
| Demographics | Rating | Rank | Unemployment |
| Liberians | 0.9 /100 | #248 | Tragic 5.6% |
| Cajuns | 0.8 /100 | #249 | Tragic 5.6% |
| Japanese | 0.8 /100 | #250 | Tragic 5.6% |
| Kiowa | 0.6 /100 | #251 | Tragic 5.7% |
| Hondurans | 0.3 /100 | #252 | Tragic 5.7% |
| Central Americans | 0.3 /100 | #253 | Tragic 5.7% |
| Immigrants | Honduras | 0.3 /100 | #254 | Tragic 5.7% |
| Immigrants | Portugal | 0.2 /100 | #255 | Tragic 5.7% |
| Guatemalans | 0.2 /100 | #256 | Tragic 5.8% |
| Yaqui | 0.2 /100 | #257 | Tragic 5.8% |
| Immigrants | Bahamas | 0.1 /100 | #258 | Tragic 5.8% |
| Sub-Saharan Africans | 0.1 /100 | #259 | Tragic 5.8% |
| Immigrants | Uzbekistan | 0.1 /100 | #260 | Tragic 5.8% |
| Immigrants | Guatemala | 0.1 /100 | #261 | Tragic 5.8% |
| Sierra Leoneans | 0.1 /100 | #262 | Tragic 5.8% |
Demographics Similar to Immigrants from Northern Africa by Unemployment
In terms of unemployment, the demographic groups most similar to Immigrants from Northern Africa are Immigrants from Kazakhstan (5.2%, a difference of 0.070%), Sri Lankan (5.2%, a difference of 0.13%), Immigrants from China (5.2%, a difference of 0.28%), Immigrants from Eastern Europe (5.2%, a difference of 0.32%), and Immigrants from Hong Kong (5.2%, a difference of 0.32%).
| Demographics | Rating | Rank | Unemployment |
| Immigrants | Italy | 79.1 /100 | #148 | Good 5.1% |
| Syrians | 77.7 /100 | #149 | Good 5.2% |
| Potawatomi | 76.2 /100 | #150 | Good 5.2% |
| Immigrants | Eastern Europe | 75.3 /100 | #151 | Good 5.2% |
| Immigrants | Hong Kong | 75.2 /100 | #152 | Good 5.2% |
| Egyptians | 75.2 /100 | #153 | Good 5.2% |
| Immigrants | China | 74.7 /100 | #154 | Good 5.2% |
| Immigrants | Northern Africa | 71.3 /100 | #155 | Good 5.2% |
| Immigrants | Kazakhstan | 70.4 /100 | #156 | Good 5.2% |
| Sri Lankans | 69.5 /100 | #157 | Good 5.2% |
| Immigrants | Egypt | 66.7 /100 | #158 | Good 5.2% |
| Immigrants | Russia | 66.6 /100 | #159 | Good 5.2% |
| Laotians | 66.3 /100 | #160 | Good 5.2% |
| Immigrants | Oceania | 65.2 /100 | #161 | Good 5.2% |
| Spanish | 65.1 /100 | #162 | Good 5.2% |