German vs Immigrants from Belize Unemployment
COMPARE
German
Immigrants from Belize
Unemployment
Unemployment Comparison
Germans
Immigrants from Belize
4.5%
UNEMPLOYMENT
100.0/ 100
METRIC RATING
6th/ 347
METRIC RANK
6.5%
UNEMPLOYMENT
0.0/ 100
METRIC RATING
310th/ 347
METRIC RANK
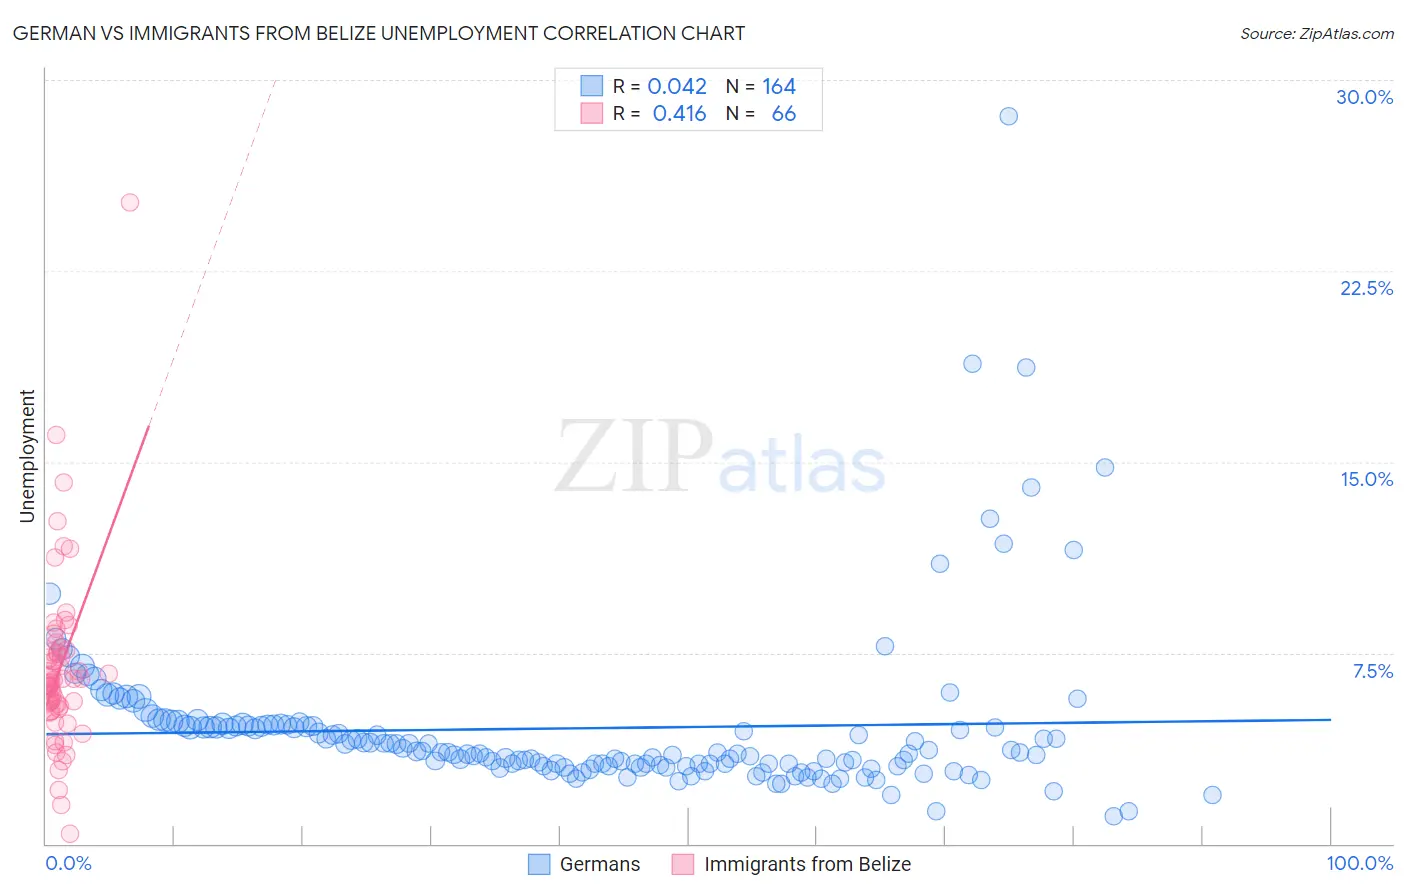
German vs Immigrants from Belize Unemployment Correlation Chart
The statistical analysis conducted on geographies consisting of 575,448,590 people shows no correlation between the proportion of Germans and unemployment in the United States with a correlation coefficient (R) of 0.042 and weighted average of 4.5%. Similarly, the statistical analysis conducted on geographies consisting of 130,280,852 people shows a moderate positive correlation between the proportion of Immigrants from Belize and unemployment in the United States with a correlation coefficient (R) of 0.416 and weighted average of 6.5%, a difference of 45.2%.
Unemployment Correlation Summary
| Measurement | German | Immigrants from Belize |
| Minimum | 1.1% | 0.40% |
| Maximum | 28.6% | 25.2% |
| Range | 27.5% | 24.8% |
| Mean | 4.5% | 6.9% |
| Median | 3.6% | 6.4% |
| Interquartile 25% (IQ1) | 3.1% | 5.4% |
| Interquartile 75% (IQ3) | 4.6% | 7.5% |
| Interquartile Range (IQR) | 1.6% | 2.2% |
| Standard Deviation (Sample) | 3.3% | 3.5% |
| Standard Deviation (Population) | 3.2% | 3.5% |
Similar Demographics by Unemployment
Demographics Similar to Germans by Unemployment
In terms of unemployment, the demographic groups most similar to Germans are Immigrants from India (4.5%, a difference of 0.55%), Swedish (4.4%, a difference of 0.79%), Swiss (4.5%, a difference of 1.0%), Scandinavian (4.5%, a difference of 1.4%), and Dutch (4.6%, a difference of 1.9%).
| Demographics | Rating | Rank | Unemployment |
| Norwegians | 100.0 /100 | #1 | Exceptional 4.2% |
| Luxembourgers | 100.0 /100 | #2 | Exceptional 4.3% |
| Czechs | 100.0 /100 | #3 | Exceptional 4.3% |
| Danes | 100.0 /100 | #4 | Exceptional 4.3% |
| Swedes | 100.0 /100 | #5 | Exceptional 4.4% |
| Germans | 100.0 /100 | #6 | Exceptional 4.5% |
| Immigrants | India | 100.0 /100 | #7 | Exceptional 4.5% |
| Swiss | 100.0 /100 | #8 | Exceptional 4.5% |
| Scandinavians | 100.0 /100 | #9 | Exceptional 4.5% |
| Dutch | 100.0 /100 | #10 | Exceptional 4.6% |
| English | 100.0 /100 | #11 | Exceptional 4.6% |
| Pennsylvania Germans | 100.0 /100 | #12 | Exceptional 4.6% |
| Belgians | 100.0 /100 | #13 | Exceptional 4.6% |
| Immigrants | Cuba | 100.0 /100 | #14 | Exceptional 4.6% |
| Europeans | 99.9 /100 | #15 | Exceptional 4.6% |
Demographics Similar to Immigrants from Belize by Unemployment
In terms of unemployment, the demographic groups most similar to Immigrants from Belize are Vietnamese (6.5%, a difference of 0.27%), Barbadian (6.5%, a difference of 0.28%), Cape Verdean (6.5%, a difference of 0.33%), Immigrants from Bangladesh (6.5%, a difference of 0.65%), and Colville (6.6%, a difference of 0.91%).
| Demographics | Rating | Rank | Unemployment |
| Belizeans | 0.0 /100 | #303 | Tragic 6.4% |
| Immigrants | Jamaica | 0.0 /100 | #304 | Tragic 6.4% |
| Menominee | 0.0 /100 | #305 | Tragic 6.4% |
| Lumbee | 0.0 /100 | #306 | Tragic 6.4% |
| Immigrants | Bangladesh | 0.0 /100 | #307 | Tragic 6.5% |
| Barbadians | 0.0 /100 | #308 | Tragic 6.5% |
| Vietnamese | 0.0 /100 | #309 | Tragic 6.5% |
| Immigrants | Belize | 0.0 /100 | #310 | Tragic 6.5% |
| Cape Verdeans | 0.0 /100 | #311 | Tragic 6.5% |
| Colville | 0.0 /100 | #312 | Tragic 6.6% |
| Immigrants | Barbados | 0.0 /100 | #313 | Tragic 6.6% |
| Blacks/African Americans | 0.0 /100 | #314 | Tragic 6.6% |
| Houma | 0.0 /100 | #315 | Tragic 6.7% |
| Immigrants | Dominica | 0.0 /100 | #316 | Tragic 6.7% |
| Shoshone | 0.0 /100 | #317 | Tragic 6.8% |