Immigrants from Portugal vs Immigrants from Latin America Unemployment
COMPARE
Immigrants from Portugal
Immigrants from Latin America
Unemployment
Unemployment Comparison
Immigrants from Portugal
Immigrants from Latin America
5.7%
UNEMPLOYMENT
0.2/ 100
METRIC RATING
255th/ 347
METRIC RANK
5.9%
UNEMPLOYMENT
0.0/ 100
METRIC RATING
275th/ 347
METRIC RANK
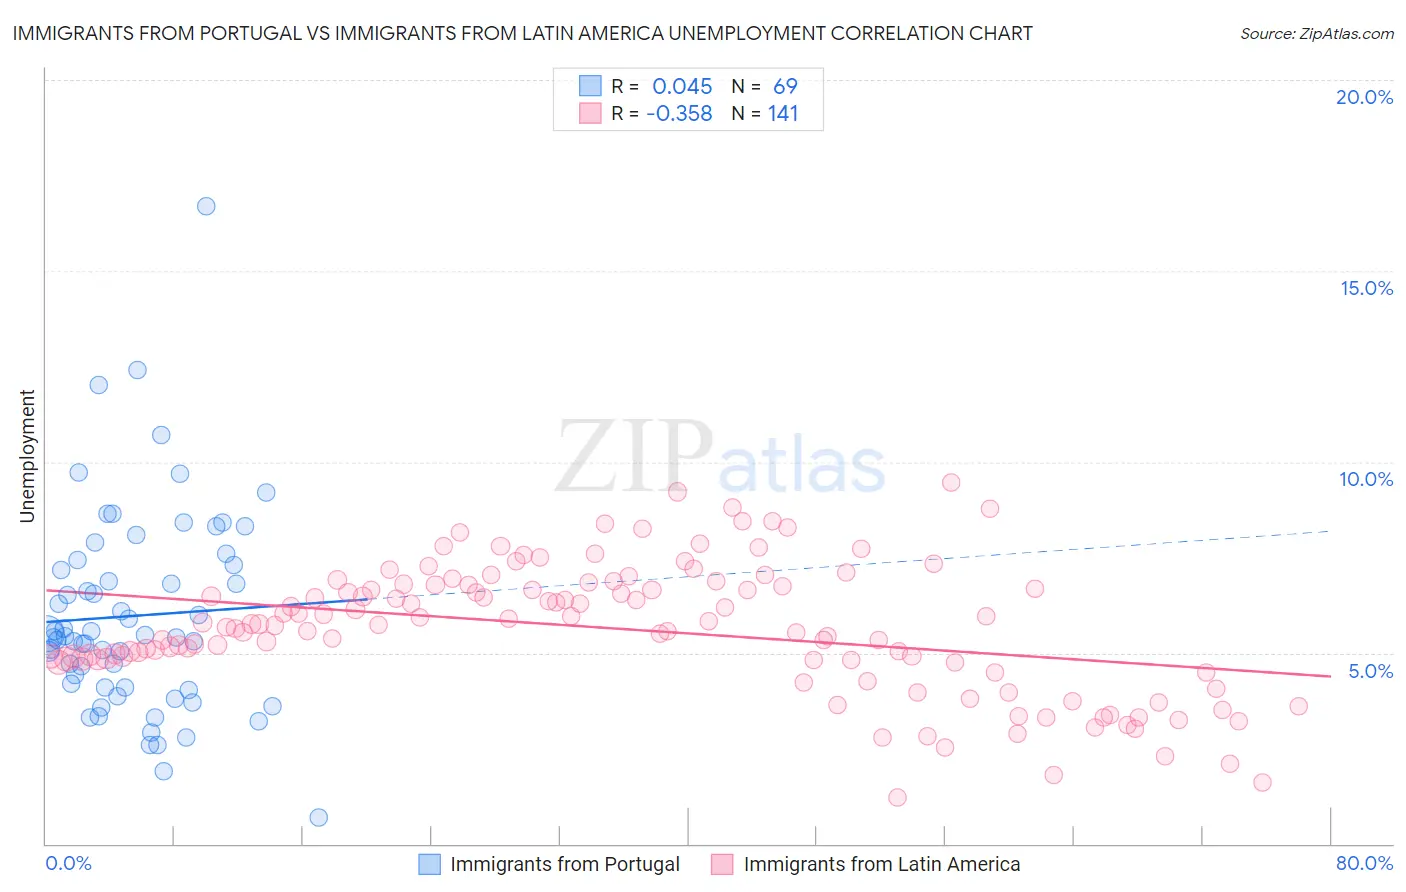
Immigrants from Portugal vs Immigrants from Latin America Unemployment Correlation Chart
The statistical analysis conducted on geographies consisting of 174,742,748 people shows no correlation between the proportion of Immigrants from Portugal and unemployment in the United States with a correlation coefficient (R) of 0.045 and weighted average of 5.7%. Similarly, the statistical analysis conducted on geographies consisting of 555,896,337 people shows a mild negative correlation between the proportion of Immigrants from Latin America and unemployment in the United States with a correlation coefficient (R) of -0.358 and weighted average of 5.9%, a difference of 3.3%.
Unemployment Correlation Summary
| Measurement | Immigrants from Portugal | Immigrants from Latin America |
| Minimum | 0.70% | 1.2% |
| Maximum | 16.7% | 9.5% |
| Range | 16.0% | 8.3% |
| Mean | 6.0% | 5.6% |
| Median | 5.4% | 5.7% |
| Interquartile 25% (IQ1) | 4.1% | 4.8% |
| Interquartile 75% (IQ3) | 7.4% | 6.8% |
| Interquartile Range (IQR) | 3.3% | 2.0% |
| Standard Deviation (Sample) | 2.7% | 1.7% |
| Standard Deviation (Population) | 2.6% | 1.7% |
Demographics Similar to Immigrants from Portugal and Immigrants from Latin America by Unemployment
In terms of unemployment, the demographic groups most similar to Immigrants from Portugal are Guatemalan (5.8%, a difference of 0.21%), Yaqui (5.8%, a difference of 0.51%), Immigrants from Bahamas (5.8%, a difference of 0.64%), Subsaharan African (5.8%, a difference of 0.77%), and Immigrants from Uzbekistan (5.8%, a difference of 0.78%). Similarly, the demographic groups most similar to Immigrants from Latin America are Bahamian (5.9%, a difference of 0.21%), Immigrants from Fiji (5.9%, a difference of 0.50%), Hispanic or Latino (5.9%, a difference of 0.67%), Mexican (5.9%, a difference of 1.3%), and Blackfeet (5.8%, a difference of 1.6%).
| Demographics | Rating | Rank | Unemployment |
| Immigrants | Portugal | 0.2 /100 | #255 | Tragic 5.7% |
| Guatemalans | 0.2 /100 | #256 | Tragic 5.8% |
| Yaqui | 0.2 /100 | #257 | Tragic 5.8% |
| Immigrants | Bahamas | 0.1 /100 | #258 | Tragic 5.8% |
| Sub-Saharan Africans | 0.1 /100 | #259 | Tragic 5.8% |
| Immigrants | Uzbekistan | 0.1 /100 | #260 | Tragic 5.8% |
| Immigrants | Guatemala | 0.1 /100 | #261 | Tragic 5.8% |
| Sierra Leoneans | 0.1 /100 | #262 | Tragic 5.8% |
| Salvadorans | 0.1 /100 | #263 | Tragic 5.8% |
| Immigrants | Liberia | 0.1 /100 | #264 | Tragic 5.8% |
| Nigerians | 0.1 /100 | #265 | Tragic 5.8% |
| Mexican American Indians | 0.1 /100 | #266 | Tragic 5.8% |
| Immigrants | Nigeria | 0.1 /100 | #267 | Tragic 5.8% |
| Immigrants | Sierra Leone | 0.1 /100 | #268 | Tragic 5.8% |
| Immigrants | El Salvador | 0.1 /100 | #269 | Tragic 5.8% |
| Blackfeet | 0.1 /100 | #270 | Tragic 5.8% |
| Mexicans | 0.1 /100 | #271 | Tragic 5.9% |
| Hispanics or Latinos | 0.0 /100 | #272 | Tragic 5.9% |
| Immigrants | Fiji | 0.0 /100 | #273 | Tragic 5.9% |
| Bahamians | 0.0 /100 | #274 | Tragic 5.9% |
| Immigrants | Latin America | 0.0 /100 | #275 | Tragic 5.9% |