Immigrants from Portugal vs Belgian Unemployment
COMPARE
Immigrants from Portugal
Belgian
Unemployment
Unemployment Comparison
Immigrants from Portugal
Belgians
5.7%
UNEMPLOYMENT
0.2/ 100
METRIC RATING
255th/ 347
METRIC RANK
4.6%
UNEMPLOYMENT
100.0/ 100
METRIC RATING
13th/ 347
METRIC RANK
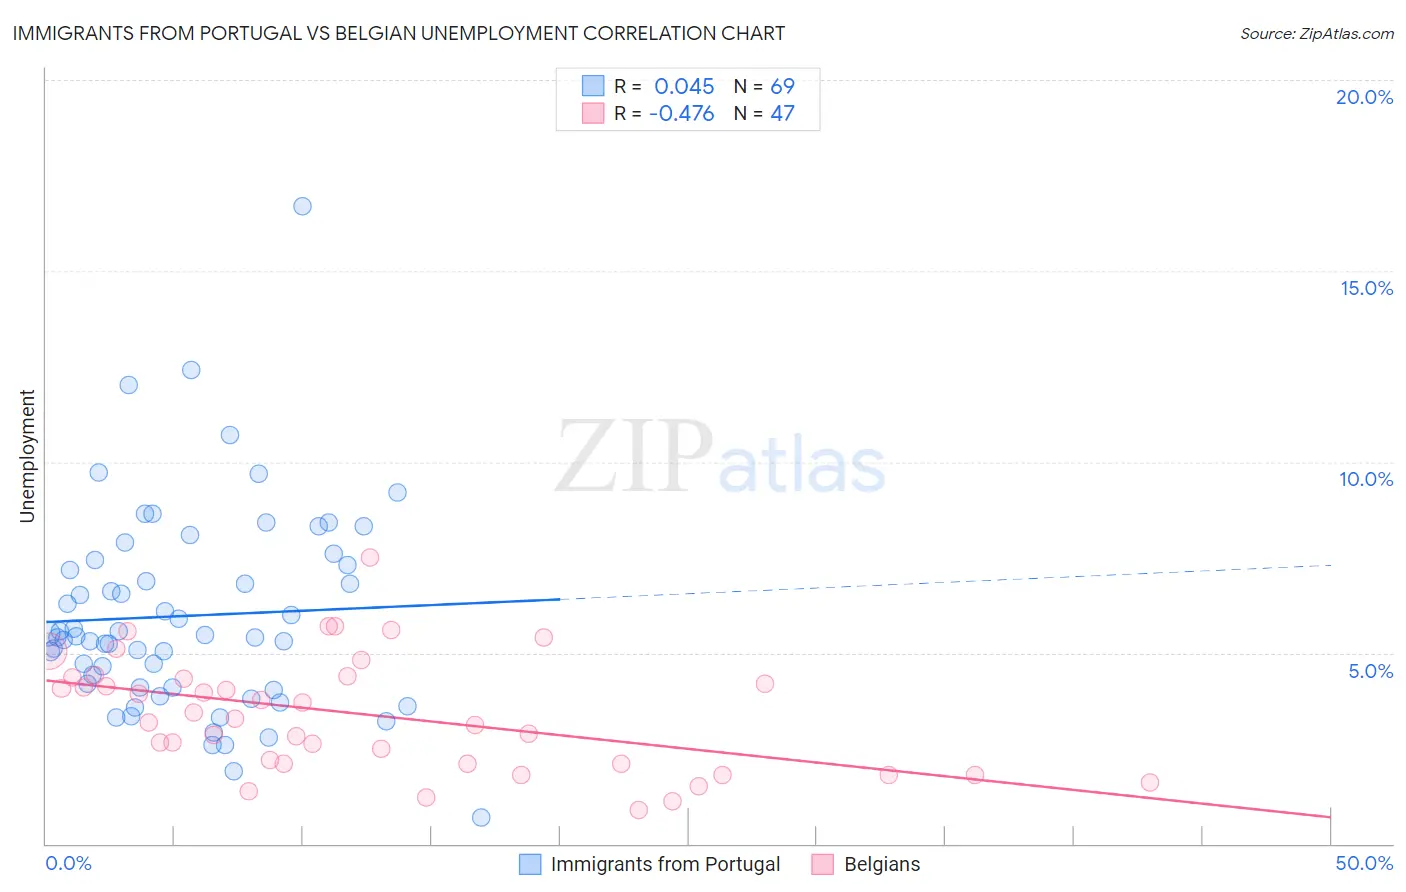
Immigrants from Portugal vs Belgian Unemployment Correlation Chart
The statistical analysis conducted on geographies consisting of 174,742,748 people shows no correlation between the proportion of Immigrants from Portugal and unemployment in the United States with a correlation coefficient (R) of 0.045 and weighted average of 5.7%. Similarly, the statistical analysis conducted on geographies consisting of 355,448,052 people shows a moderate negative correlation between the proportion of Belgians and unemployment in the United States with a correlation coefficient (R) of -0.476 and weighted average of 4.6%, a difference of 24.6%.
Unemployment Correlation Summary
| Measurement | Immigrants from Portugal | Belgian |
| Minimum | 0.70% | 0.90% |
| Maximum | 16.7% | 7.5% |
| Range | 16.0% | 6.6% |
| Mean | 6.0% | 3.4% |
| Median | 5.4% | 3.3% |
| Interquartile 25% (IQ1) | 4.1% | 2.1% |
| Interquartile 75% (IQ3) | 7.4% | 4.4% |
| Interquartile Range (IQR) | 3.3% | 2.3% |
| Standard Deviation (Sample) | 2.7% | 1.5% |
| Standard Deviation (Population) | 2.6% | 1.5% |
Similar Demographics by Unemployment
Demographics Similar to Immigrants from Portugal by Unemployment
In terms of unemployment, the demographic groups most similar to Immigrants from Portugal are Guatemalan (5.8%, a difference of 0.21%), Immigrants from Honduras (5.7%, a difference of 0.44%), Yaqui (5.8%, a difference of 0.51%), Central American (5.7%, a difference of 0.52%), and Honduran (5.7%, a difference of 0.53%).
| Demographics | Rating | Rank | Unemployment |
| Liberians | 0.9 /100 | #248 | Tragic 5.6% |
| Cajuns | 0.8 /100 | #249 | Tragic 5.6% |
| Japanese | 0.8 /100 | #250 | Tragic 5.6% |
| Kiowa | 0.6 /100 | #251 | Tragic 5.7% |
| Hondurans | 0.3 /100 | #252 | Tragic 5.7% |
| Central Americans | 0.3 /100 | #253 | Tragic 5.7% |
| Immigrants | Honduras | 0.3 /100 | #254 | Tragic 5.7% |
| Immigrants | Portugal | 0.2 /100 | #255 | Tragic 5.7% |
| Guatemalans | 0.2 /100 | #256 | Tragic 5.8% |
| Yaqui | 0.2 /100 | #257 | Tragic 5.8% |
| Immigrants | Bahamas | 0.1 /100 | #258 | Tragic 5.8% |
| Sub-Saharan Africans | 0.1 /100 | #259 | Tragic 5.8% |
| Immigrants | Uzbekistan | 0.1 /100 | #260 | Tragic 5.8% |
| Immigrants | Guatemala | 0.1 /100 | #261 | Tragic 5.8% |
| Sierra Leoneans | 0.1 /100 | #262 | Tragic 5.8% |
Demographics Similar to Belgians by Unemployment
In terms of unemployment, the demographic groups most similar to Belgians are Pennsylvania German (4.6%, a difference of 0.16%), Immigrants from Cuba (4.6%, a difference of 0.24%), English (4.6%, a difference of 0.26%), European (4.6%, a difference of 0.72%), and Chinese (4.7%, a difference of 0.86%).
| Demographics | Rating | Rank | Unemployment |
| Germans | 100.0 /100 | #6 | Exceptional 4.5% |
| Immigrants | India | 100.0 /100 | #7 | Exceptional 4.5% |
| Swiss | 100.0 /100 | #8 | Exceptional 4.5% |
| Scandinavians | 100.0 /100 | #9 | Exceptional 4.5% |
| Dutch | 100.0 /100 | #10 | Exceptional 4.6% |
| English | 100.0 /100 | #11 | Exceptional 4.6% |
| Pennsylvania Germans | 100.0 /100 | #12 | Exceptional 4.6% |
| Belgians | 100.0 /100 | #13 | Exceptional 4.6% |
| Immigrants | Cuba | 100.0 /100 | #14 | Exceptional 4.6% |
| Europeans | 99.9 /100 | #15 | Exceptional 4.6% |
| Chinese | 99.9 /100 | #16 | Exceptional 4.7% |
| Slovenes | 99.9 /100 | #17 | Exceptional 4.7% |
| Immigrants | Venezuela | 99.9 /100 | #18 | Exceptional 4.7% |
| Scottish | 99.9 /100 | #19 | Exceptional 4.7% |
| Carpatho Rusyns | 99.9 /100 | #20 | Exceptional 4.7% |