Immigrants from Nigeria vs Nicaraguan Unemployment
COMPARE
Immigrants from Nigeria
Nicaraguan
Unemployment
Unemployment Comparison
Immigrants from Nigeria
Nicaraguans
5.8%
UNEMPLOYMENT
0.1/ 100
METRIC RATING
267th/ 347
METRIC RANK
5.3%
UNEMPLOYMENT
48.7/ 100
METRIC RATING
176th/ 347
METRIC RANK
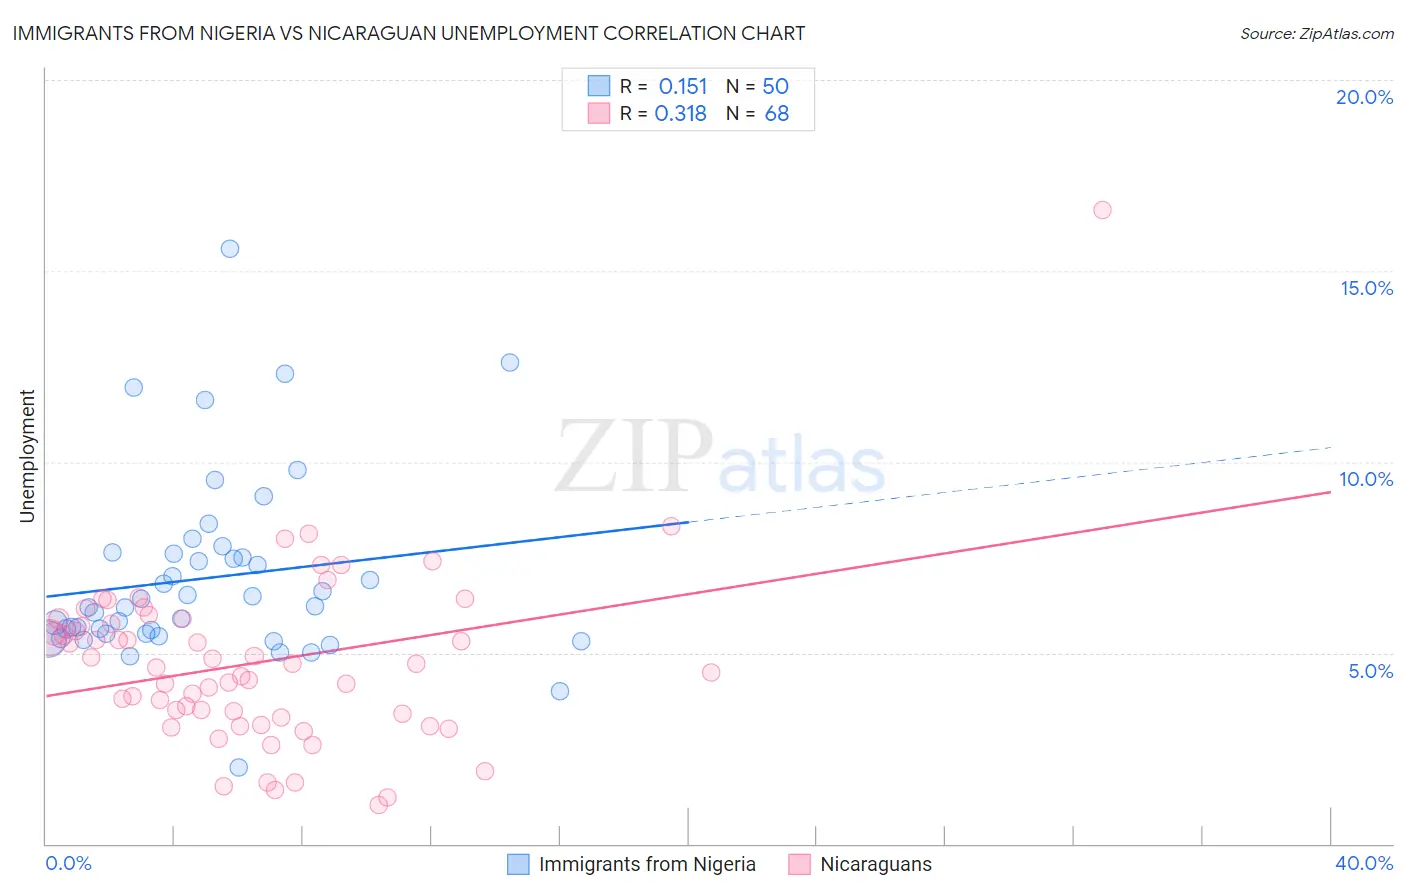
Immigrants from Nigeria vs Nicaraguan Unemployment Correlation Chart
The statistical analysis conducted on geographies consisting of 283,412,431 people shows a poor positive correlation between the proportion of Immigrants from Nigeria and unemployment in the United States with a correlation coefficient (R) of 0.151 and weighted average of 5.8%. Similarly, the statistical analysis conducted on geographies consisting of 285,592,147 people shows a mild positive correlation between the proportion of Nicaraguans and unemployment in the United States with a correlation coefficient (R) of 0.318 and weighted average of 5.3%, a difference of 11.0%.
Unemployment Correlation Summary
| Measurement | Immigrants from Nigeria | Nicaraguan |
| Minimum | 2.0% | 1.0% |
| Maximum | 15.6% | 16.6% |
| Range | 13.6% | 15.6% |
| Mean | 7.0% | 4.7% |
| Median | 6.2% | 4.7% |
| Interquartile 25% (IQ1) | 5.5% | 3.4% |
| Interquartile 75% (IQ3) | 7.6% | 5.8% |
| Interquartile Range (IQR) | 2.1% | 2.5% |
| Standard Deviation (Sample) | 2.4% | 2.3% |
| Standard Deviation (Population) | 2.4% | 2.3% |
Similar Demographics by Unemployment
Demographics Similar to Immigrants from Nigeria by Unemployment
In terms of unemployment, the demographic groups most similar to Immigrants from Nigeria are Immigrants from Sierra Leone (5.8%, a difference of 0.040%), Immigrants from El Salvador (5.8%, a difference of 0.050%), Mexican American Indian (5.8%, a difference of 0.070%), Blackfeet (5.8%, a difference of 0.13%), and Mexican (5.9%, a difference of 0.36%).
| Demographics | Rating | Rank | Unemployment |
| Immigrants | Uzbekistan | 0.1 /100 | #260 | Tragic 5.8% |
| Immigrants | Guatemala | 0.1 /100 | #261 | Tragic 5.8% |
| Sierra Leoneans | 0.1 /100 | #262 | Tragic 5.8% |
| Salvadorans | 0.1 /100 | #263 | Tragic 5.8% |
| Immigrants | Liberia | 0.1 /100 | #264 | Tragic 5.8% |
| Nigerians | 0.1 /100 | #265 | Tragic 5.8% |
| Mexican American Indians | 0.1 /100 | #266 | Tragic 5.8% |
| Immigrants | Nigeria | 0.1 /100 | #267 | Tragic 5.8% |
| Immigrants | Sierra Leone | 0.1 /100 | #268 | Tragic 5.8% |
| Immigrants | El Salvador | 0.1 /100 | #269 | Tragic 5.8% |
| Blackfeet | 0.1 /100 | #270 | Tragic 5.8% |
| Mexicans | 0.1 /100 | #271 | Tragic 5.9% |
| Hispanics or Latinos | 0.0 /100 | #272 | Tragic 5.9% |
| Immigrants | Fiji | 0.0 /100 | #273 | Tragic 5.9% |
| Bahamians | 0.0 /100 | #274 | Tragic 5.9% |
Demographics Similar to Nicaraguans by Unemployment
In terms of unemployment, the demographic groups most similar to Nicaraguans are Nonimmigrants (5.3%, a difference of 0.050%), Taiwanese (5.3%, a difference of 0.060%), Immigrants from Congo (5.3%, a difference of 0.080%), Afghan (5.3%, a difference of 0.080%), and Malaysian (5.3%, a difference of 0.11%).
| Demographics | Rating | Rank | Unemployment |
| Immigrants | Morocco | 59.1 /100 | #169 | Average 5.2% |
| Immigrants | Nicaragua | 57.1 /100 | #170 | Average 5.2% |
| Puget Sound Salish | 56.6 /100 | #171 | Average 5.2% |
| Immigrants | Vietnam | 52.5 /100 | #172 | Average 5.2% |
| Immigrants | Poland | 51.8 /100 | #173 | Average 5.3% |
| Immigrants | Congo | 50.0 /100 | #174 | Average 5.3% |
| Taiwanese | 49.6 /100 | #175 | Average 5.3% |
| Nicaraguans | 48.7 /100 | #176 | Average 5.3% |
| Immigrants | Nonimmigrants | 47.9 /100 | #177 | Average 5.3% |
| Afghans | 47.4 /100 | #178 | Average 5.3% |
| Malaysians | 46.8 /100 | #179 | Average 5.3% |
| Immigrants | Greece | 45.0 /100 | #180 | Average 5.3% |
| Albanians | 43.5 /100 | #181 | Average 5.3% |
| Spaniards | 42.2 /100 | #182 | Average 5.3% |
| Brazilians | 40.2 /100 | #183 | Average 5.3% |