Iranian vs Nicaraguan Unemployment
COMPARE
Iranian
Nicaraguan
Unemployment
Unemployment Comparison
Iranians
Nicaraguans
5.1%
UNEMPLOYMENT
86.9/ 100
METRIC RATING
130th/ 347
METRIC RANK
5.3%
UNEMPLOYMENT
48.7/ 100
METRIC RATING
176th/ 347
METRIC RANK
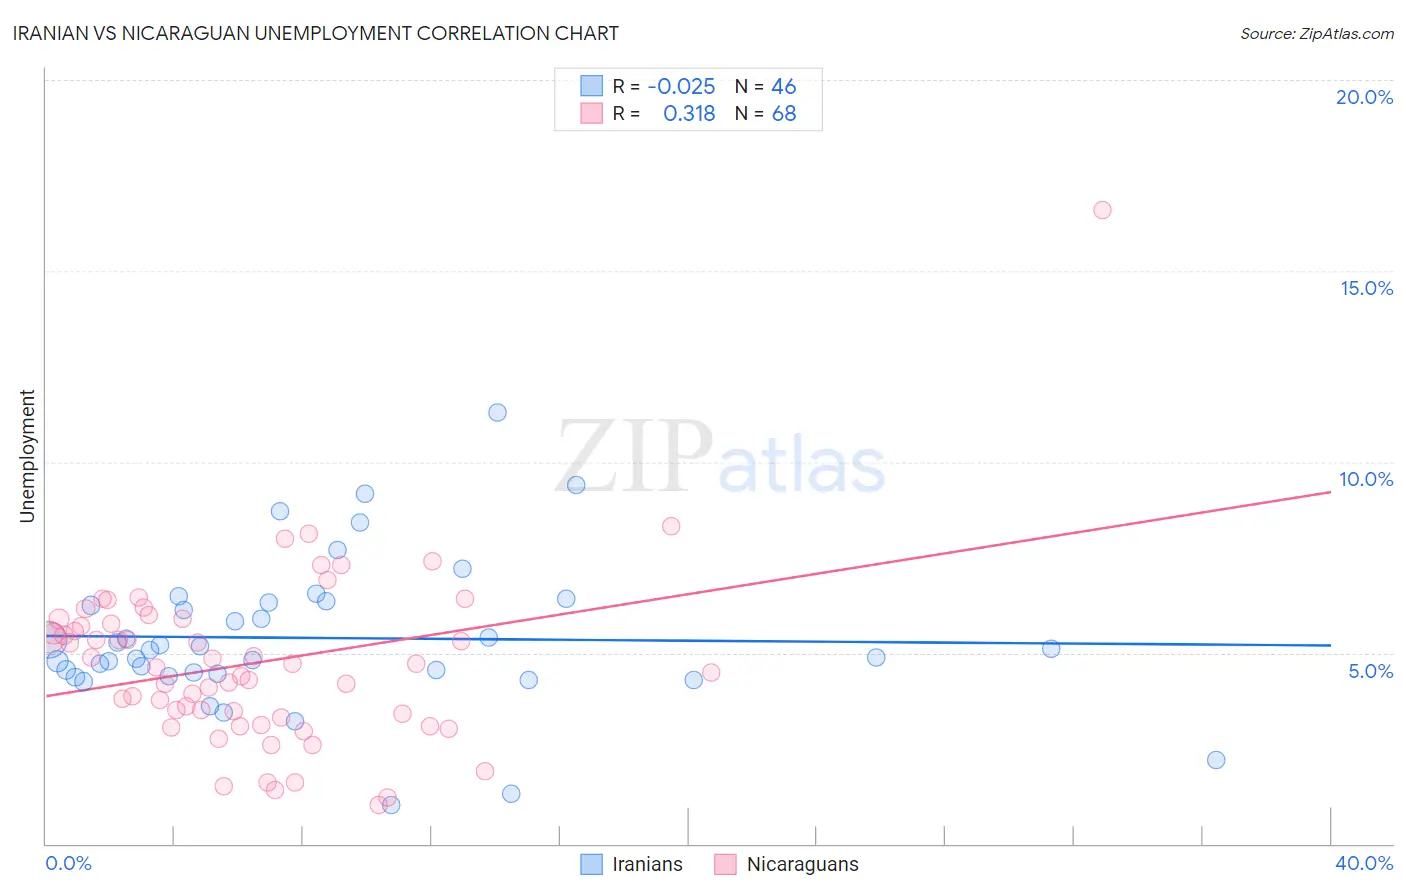
Iranian vs Nicaraguan Unemployment Correlation Chart
The statistical analysis conducted on geographies consisting of 316,755,420 people shows no correlation between the proportion of Iranians and unemployment in the United States with a correlation coefficient (R) of -0.025 and weighted average of 5.1%. Similarly, the statistical analysis conducted on geographies consisting of 285,592,147 people shows a mild positive correlation between the proportion of Nicaraguans and unemployment in the United States with a correlation coefficient (R) of 0.318 and weighted average of 5.3%, a difference of 3.1%.
Unemployment Correlation Summary
| Measurement | Iranian | Nicaraguan |
| Minimum | 1.0% | 1.0% |
| Maximum | 11.3% | 16.6% |
| Range | 10.3% | 15.6% |
| Mean | 5.4% | 4.7% |
| Median | 5.1% | 4.7% |
| Interquartile 25% (IQ1) | 4.4% | 3.4% |
| Interquartile 75% (IQ3) | 6.3% | 5.8% |
| Interquartile Range (IQR) | 1.9% | 2.5% |
| Standard Deviation (Sample) | 1.9% | 2.3% |
| Standard Deviation (Population) | 1.9% | 2.3% |
Similar Demographics by Unemployment
Demographics Similar to Iranians by Unemployment
In terms of unemployment, the demographic groups most similar to Iranians are Immigrants from Croatia (5.1%, a difference of 0.030%), Immigrants from Ethiopia (5.1%, a difference of 0.030%), Immigrants from Jordan (5.1%, a difference of 0.040%), Immigrants from Europe (5.1%, a difference of 0.090%), and Immigrants from Burma/Myanmar (5.1%, a difference of 0.090%).
| Demographics | Rating | Rank | Unemployment |
| Asians | 89.0 /100 | #123 | Excellent 5.1% |
| Ethiopians | 88.6 /100 | #124 | Excellent 5.1% |
| Immigrants | Eastern Asia | 88.3 /100 | #125 | Excellent 5.1% |
| Kenyans | 88.2 /100 | #126 | Excellent 5.1% |
| Immigrants | Kenya | 88.2 /100 | #127 | Excellent 5.1% |
| Immigrants | Eastern Africa | 88.1 /100 | #128 | Excellent 5.1% |
| Immigrants | Latvia | 88.0 /100 | #129 | Excellent 5.1% |
| Iranians | 86.9 /100 | #130 | Excellent 5.1% |
| Immigrants | Croatia | 86.8 /100 | #131 | Excellent 5.1% |
| Immigrants | Ethiopia | 86.7 /100 | #132 | Excellent 5.1% |
| Immigrants | Jordan | 86.6 /100 | #133 | Excellent 5.1% |
| Immigrants | Europe | 86.3 /100 | #134 | Excellent 5.1% |
| Immigrants | Burma/Myanmar | 86.2 /100 | #135 | Excellent 5.1% |
| Immigrants | Spain | 86.2 /100 | #136 | Excellent 5.1% |
| Immigrants | Saudi Arabia | 85.6 /100 | #137 | Excellent 5.1% |
Demographics Similar to Nicaraguans by Unemployment
In terms of unemployment, the demographic groups most similar to Nicaraguans are Nonimmigrants (5.3%, a difference of 0.050%), Taiwanese (5.3%, a difference of 0.060%), Immigrants from Congo (5.3%, a difference of 0.080%), Afghan (5.3%, a difference of 0.080%), and Malaysian (5.3%, a difference of 0.11%).
| Demographics | Rating | Rank | Unemployment |
| Immigrants | Morocco | 59.1 /100 | #169 | Average 5.2% |
| Immigrants | Nicaragua | 57.1 /100 | #170 | Average 5.2% |
| Puget Sound Salish | 56.6 /100 | #171 | Average 5.2% |
| Immigrants | Vietnam | 52.5 /100 | #172 | Average 5.2% |
| Immigrants | Poland | 51.8 /100 | #173 | Average 5.3% |
| Immigrants | Congo | 50.0 /100 | #174 | Average 5.3% |
| Taiwanese | 49.6 /100 | #175 | Average 5.3% |
| Nicaraguans | 48.7 /100 | #176 | Average 5.3% |
| Immigrants | Nonimmigrants | 47.9 /100 | #177 | Average 5.3% |
| Afghans | 47.4 /100 | #178 | Average 5.3% |
| Malaysians | 46.8 /100 | #179 | Average 5.3% |
| Immigrants | Greece | 45.0 /100 | #180 | Average 5.3% |
| Albanians | 43.5 /100 | #181 | Average 5.3% |
| Spaniards | 42.2 /100 | #182 | Average 5.3% |
| Brazilians | 40.2 /100 | #183 | Average 5.3% |