Immigrants from Nigeria vs Brazilian Unemployment
COMPARE
Immigrants from Nigeria
Brazilian
Unemployment
Unemployment Comparison
Immigrants from Nigeria
Brazilians
5.8%
UNEMPLOYMENT
0.1/ 100
METRIC RATING
267th/ 347
METRIC RANK
5.3%
UNEMPLOYMENT
40.2/ 100
METRIC RATING
183rd/ 347
METRIC RANK
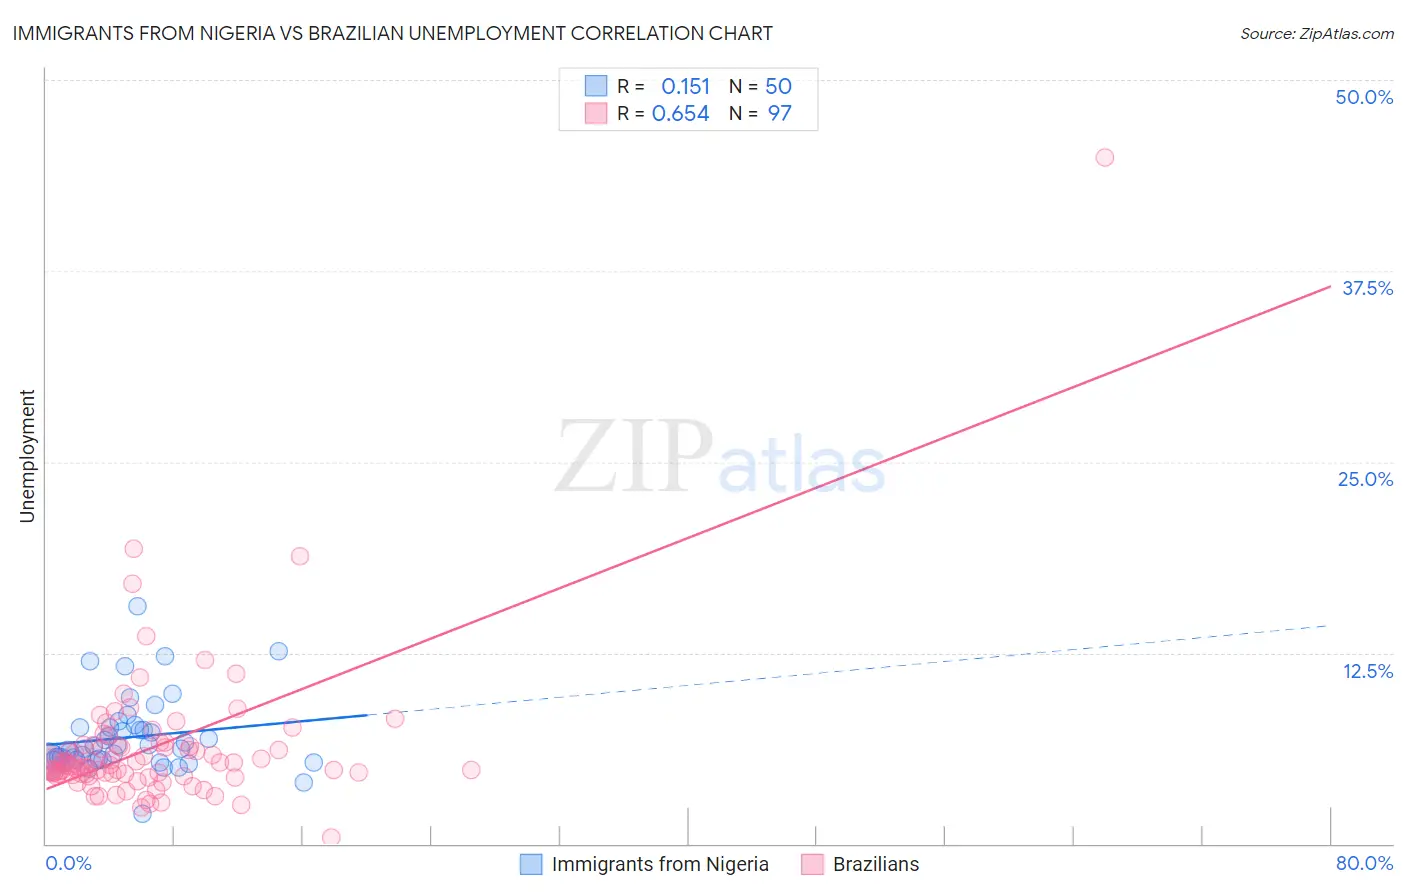
Immigrants from Nigeria vs Brazilian Unemployment Correlation Chart
The statistical analysis conducted on geographies consisting of 283,412,431 people shows a poor positive correlation between the proportion of Immigrants from Nigeria and unemployment in the United States with a correlation coefficient (R) of 0.151 and weighted average of 5.8%. Similarly, the statistical analysis conducted on geographies consisting of 323,781,873 people shows a significant positive correlation between the proportion of Brazilians and unemployment in the United States with a correlation coefficient (R) of 0.654 and weighted average of 5.3%, a difference of 10.4%.
Unemployment Correlation Summary
| Measurement | Immigrants from Nigeria | Brazilian |
| Minimum | 2.0% | 0.40% |
| Maximum | 15.6% | 44.9% |
| Range | 13.6% | 44.5% |
| Mean | 7.0% | 6.3% |
| Median | 6.2% | 5.2% |
| Interquartile 25% (IQ1) | 5.5% | 4.5% |
| Interquartile 75% (IQ3) | 7.6% | 6.4% |
| Interquartile Range (IQR) | 2.1% | 1.9% |
| Standard Deviation (Sample) | 2.4% | 5.0% |
| Standard Deviation (Population) | 2.4% | 5.0% |
Similar Demographics by Unemployment
Demographics Similar to Immigrants from Nigeria by Unemployment
In terms of unemployment, the demographic groups most similar to Immigrants from Nigeria are Immigrants from Sierra Leone (5.8%, a difference of 0.040%), Immigrants from El Salvador (5.8%, a difference of 0.050%), Mexican American Indian (5.8%, a difference of 0.070%), Blackfeet (5.8%, a difference of 0.13%), and Mexican (5.9%, a difference of 0.36%).
| Demographics | Rating | Rank | Unemployment |
| Immigrants | Uzbekistan | 0.1 /100 | #260 | Tragic 5.8% |
| Immigrants | Guatemala | 0.1 /100 | #261 | Tragic 5.8% |
| Sierra Leoneans | 0.1 /100 | #262 | Tragic 5.8% |
| Salvadorans | 0.1 /100 | #263 | Tragic 5.8% |
| Immigrants | Liberia | 0.1 /100 | #264 | Tragic 5.8% |
| Nigerians | 0.1 /100 | #265 | Tragic 5.8% |
| Mexican American Indians | 0.1 /100 | #266 | Tragic 5.8% |
| Immigrants | Nigeria | 0.1 /100 | #267 | Tragic 5.8% |
| Immigrants | Sierra Leone | 0.1 /100 | #268 | Tragic 5.8% |
| Immigrants | El Salvador | 0.1 /100 | #269 | Tragic 5.8% |
| Blackfeet | 0.1 /100 | #270 | Tragic 5.8% |
| Mexicans | 0.1 /100 | #271 | Tragic 5.9% |
| Hispanics or Latinos | 0.0 /100 | #272 | Tragic 5.9% |
| Immigrants | Fiji | 0.0 /100 | #273 | Tragic 5.9% |
| Bahamians | 0.0 /100 | #274 | Tragic 5.9% |
Demographics Similar to Brazilians by Unemployment
In terms of unemployment, the demographic groups most similar to Brazilians are Assyrian/Chaldean/Syriac (5.3%, a difference of 0.060%), Immigrants from Thailand (5.3%, a difference of 0.080%), Spaniard (5.3%, a difference of 0.13%), Immigrants from Uganda (5.3%, a difference of 0.15%), and Costa Rican (5.3%, a difference of 0.18%).
| Demographics | Rating | Rank | Unemployment |
| Nicaraguans | 48.7 /100 | #176 | Average 5.3% |
| Immigrants | Nonimmigrants | 47.9 /100 | #177 | Average 5.3% |
| Afghans | 47.4 /100 | #178 | Average 5.3% |
| Malaysians | 46.8 /100 | #179 | Average 5.3% |
| Immigrants | Greece | 45.0 /100 | #180 | Average 5.3% |
| Albanians | 43.5 /100 | #181 | Average 5.3% |
| Spaniards | 42.2 /100 | #182 | Average 5.3% |
| Brazilians | 40.2 /100 | #183 | Average 5.3% |
| Assyrians/Chaldeans/Syriacs | 39.2 /100 | #184 | Fair 5.3% |
| Immigrants | Thailand | 38.9 /100 | #185 | Fair 5.3% |
| Immigrants | Uganda | 37.8 /100 | #186 | Fair 5.3% |
| Costa Ricans | 37.4 /100 | #187 | Fair 5.3% |
| Alsatians | 37.0 /100 | #188 | Fair 5.3% |
| Immigrants | Belarus | 35.6 /100 | #189 | Fair 5.3% |
| Arabs | 35.3 /100 | #190 | Fair 5.3% |