Immigrants from Nigeria vs Jamaican Unemployment
COMPARE
Immigrants from Nigeria
Jamaican
Unemployment
Unemployment Comparison
Immigrants from Nigeria
Jamaicans
5.8%
UNEMPLOYMENT
0.1/ 100
METRIC RATING
267th/ 347
METRIC RANK
6.3%
UNEMPLOYMENT
0.0/ 100
METRIC RATING
297th/ 347
METRIC RANK
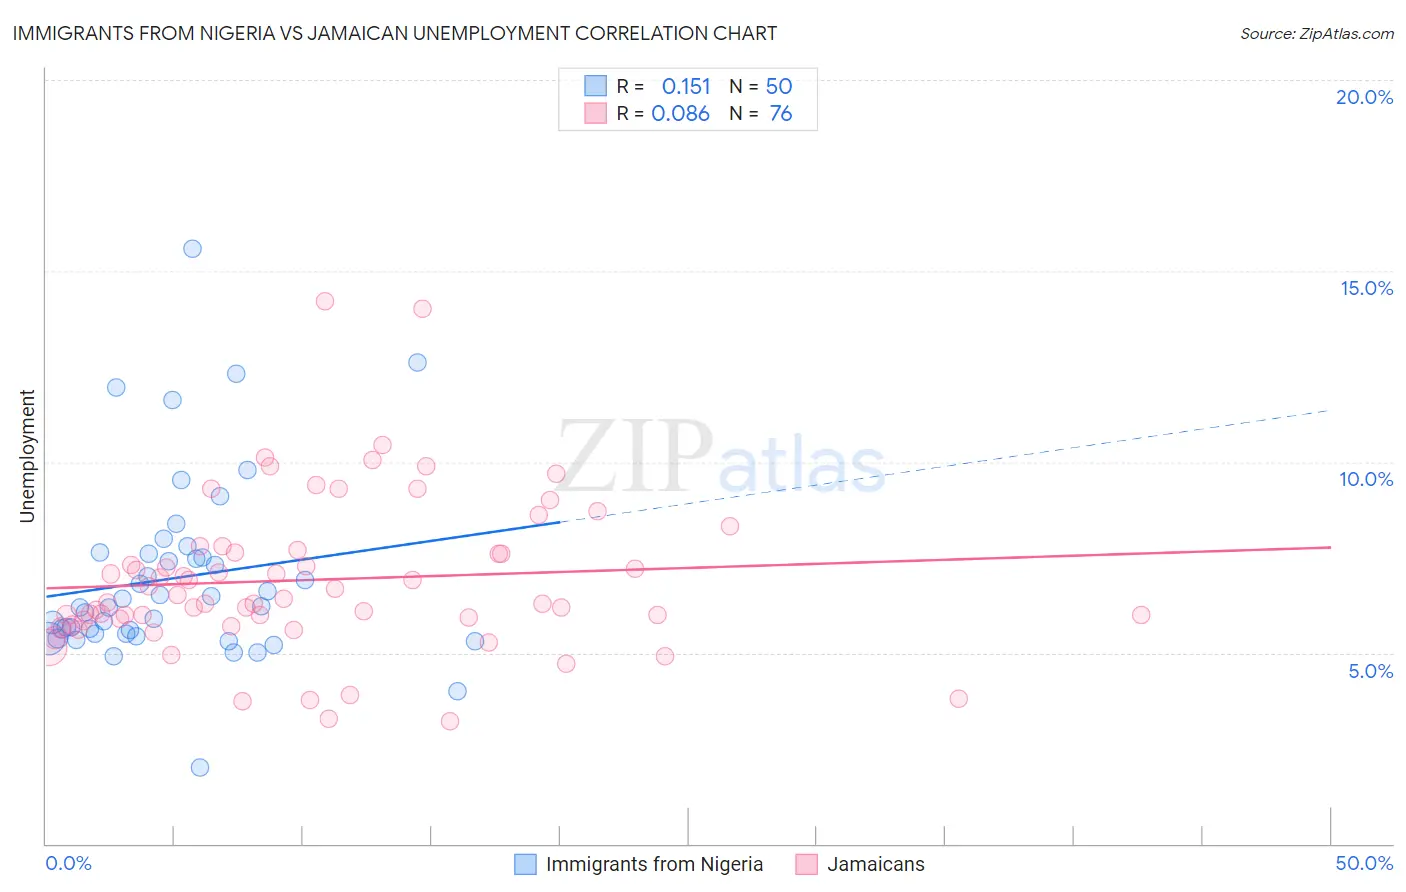
Immigrants from Nigeria vs Jamaican Unemployment Correlation Chart
The statistical analysis conducted on geographies consisting of 283,412,431 people shows a poor positive correlation between the proportion of Immigrants from Nigeria and unemployment in the United States with a correlation coefficient (R) of 0.151 and weighted average of 5.8%. Similarly, the statistical analysis conducted on geographies consisting of 367,761,379 people shows a slight positive correlation between the proportion of Jamaicans and unemployment in the United States with a correlation coefficient (R) of 0.086 and weighted average of 6.3%, a difference of 7.9%.
Unemployment Correlation Summary
| Measurement | Immigrants from Nigeria | Jamaican |
| Minimum | 2.0% | 3.2% |
| Maximum | 15.6% | 14.2% |
| Range | 13.6% | 11.0% |
| Mean | 7.0% | 6.9% |
| Median | 6.2% | 6.4% |
| Interquartile 25% (IQ1) | 5.5% | 5.9% |
| Interquartile 75% (IQ3) | 7.6% | 7.7% |
| Interquartile Range (IQR) | 2.1% | 1.8% |
| Standard Deviation (Sample) | 2.4% | 2.0% |
| Standard Deviation (Population) | 2.4% | 2.0% |
Similar Demographics by Unemployment
Demographics Similar to Immigrants from Nigeria by Unemployment
In terms of unemployment, the demographic groups most similar to Immigrants from Nigeria are Immigrants from Sierra Leone (5.8%, a difference of 0.040%), Immigrants from El Salvador (5.8%, a difference of 0.050%), Mexican American Indian (5.8%, a difference of 0.070%), Blackfeet (5.8%, a difference of 0.13%), and Mexican (5.9%, a difference of 0.36%).
| Demographics | Rating | Rank | Unemployment |
| Immigrants | Uzbekistan | 0.1 /100 | #260 | Tragic 5.8% |
| Immigrants | Guatemala | 0.1 /100 | #261 | Tragic 5.8% |
| Sierra Leoneans | 0.1 /100 | #262 | Tragic 5.8% |
| Salvadorans | 0.1 /100 | #263 | Tragic 5.8% |
| Immigrants | Liberia | 0.1 /100 | #264 | Tragic 5.8% |
| Nigerians | 0.1 /100 | #265 | Tragic 5.8% |
| Mexican American Indians | 0.1 /100 | #266 | Tragic 5.8% |
| Immigrants | Nigeria | 0.1 /100 | #267 | Tragic 5.8% |
| Immigrants | Sierra Leone | 0.1 /100 | #268 | Tragic 5.8% |
| Immigrants | El Salvador | 0.1 /100 | #269 | Tragic 5.8% |
| Blackfeet | 0.1 /100 | #270 | Tragic 5.8% |
| Mexicans | 0.1 /100 | #271 | Tragic 5.9% |
| Hispanics or Latinos | 0.0 /100 | #272 | Tragic 5.9% |
| Immigrants | Fiji | 0.0 /100 | #273 | Tragic 5.9% |
| Bahamians | 0.0 /100 | #274 | Tragic 5.9% |
Demographics Similar to Jamaicans by Unemployment
In terms of unemployment, the demographic groups most similar to Jamaicans are Immigrants from Haiti (6.3%, a difference of 0.090%), Immigrants from West Indies (6.3%, a difference of 0.14%), Immigrants from Trinidad and Tobago (6.3%, a difference of 0.26%), Ute (6.3%, a difference of 0.34%), and Trinidadian and Tobagonian (6.3%, a difference of 0.74%).
| Demographics | Rating | Rank | Unemployment |
| Senegalese | 0.0 /100 | #290 | Tragic 6.2% |
| Haitians | 0.0 /100 | #291 | Tragic 6.2% |
| Central American Indians | 0.0 /100 | #292 | Tragic 6.2% |
| Immigrants | Ecuador | 0.0 /100 | #293 | Tragic 6.2% |
| Spanish American Indians | 0.0 /100 | #294 | Tragic 6.2% |
| U.S. Virgin Islanders | 0.0 /100 | #295 | Tragic 6.3% |
| Ute | 0.0 /100 | #296 | Tragic 6.3% |
| Jamaicans | 0.0 /100 | #297 | Tragic 6.3% |
| Immigrants | Haiti | 0.0 /100 | #298 | Tragic 6.3% |
| Immigrants | West Indies | 0.0 /100 | #299 | Tragic 6.3% |
| Immigrants | Trinidad and Tobago | 0.0 /100 | #300 | Tragic 6.3% |
| Trinidadians and Tobagonians | 0.0 /100 | #301 | Tragic 6.3% |
| West Indians | 0.0 /100 | #302 | Tragic 6.4% |
| Belizeans | 0.0 /100 | #303 | Tragic 6.4% |
| Immigrants | Jamaica | 0.0 /100 | #304 | Tragic 6.4% |