Immigrants from Guyana vs Nicaraguan Unemployment
COMPARE
Immigrants from Guyana
Nicaraguan
Unemployment
Unemployment Comparison
Immigrants from Guyana
Nicaraguans
6.9%
UNEMPLOYMENT
0.0/ 100
METRIC RATING
321st/ 347
METRIC RANK
5.3%
UNEMPLOYMENT
48.7/ 100
METRIC RATING
176th/ 347
METRIC RANK
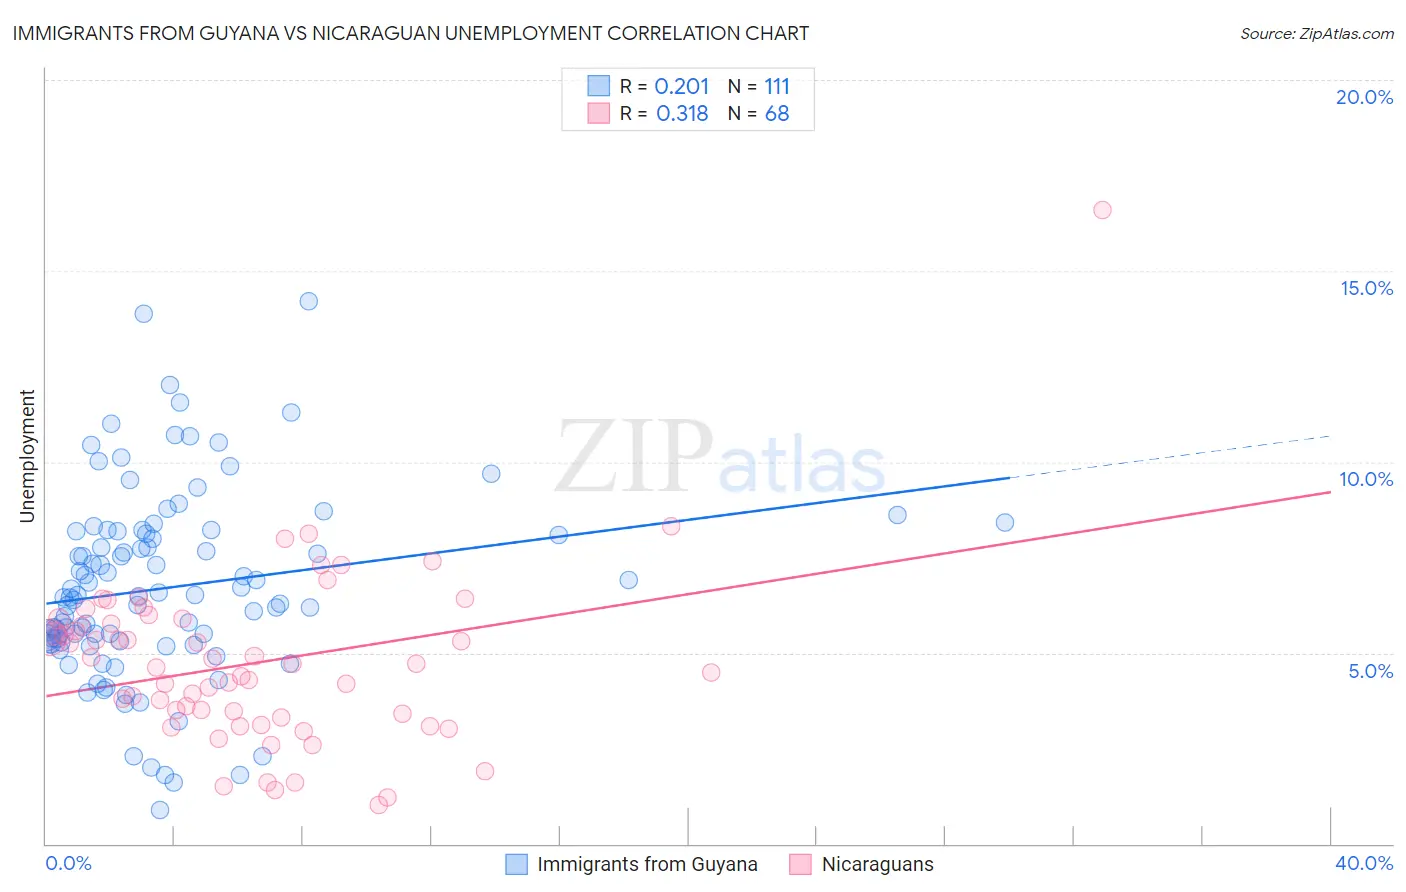
Immigrants from Guyana vs Nicaraguan Unemployment Correlation Chart
The statistical analysis conducted on geographies consisting of 183,677,376 people shows a weak positive correlation between the proportion of Immigrants from Guyana and unemployment in the United States with a correlation coefficient (R) of 0.201 and weighted average of 6.9%. Similarly, the statistical analysis conducted on geographies consisting of 285,592,147 people shows a mild positive correlation between the proportion of Nicaraguans and unemployment in the United States with a correlation coefficient (R) of 0.318 and weighted average of 5.3%, a difference of 30.9%.
Unemployment Correlation Summary
| Measurement | Immigrants from Guyana | Nicaraguan |
| Minimum | 0.90% | 1.0% |
| Maximum | 14.2% | 16.6% |
| Range | 13.3% | 15.6% |
| Mean | 6.7% | 4.7% |
| Median | 6.5% | 4.7% |
| Interquartile 25% (IQ1) | 5.3% | 3.4% |
| Interquartile 75% (IQ3) | 8.2% | 5.8% |
| Interquartile Range (IQR) | 2.9% | 2.5% |
| Standard Deviation (Sample) | 2.5% | 2.3% |
| Standard Deviation (Population) | 2.5% | 2.3% |
Similar Demographics by Unemployment
Demographics Similar to Immigrants from Guyana by Unemployment
In terms of unemployment, the demographic groups most similar to Immigrants from Guyana are Immigrants from St. Vincent and the Grenadines (6.9%, a difference of 0.010%), Guyanese (6.9%, a difference of 0.040%), Immigrants from Grenada (6.9%, a difference of 0.36%), British West Indian (6.8%, a difference of 0.81%), and Immigrants from Cabo Verde (6.8%, a difference of 1.0%).
| Demographics | Rating | Rank | Unemployment |
| Blacks/African Americans | 0.0 /100 | #314 | Tragic 6.6% |
| Houma | 0.0 /100 | #315 | Tragic 6.7% |
| Immigrants | Dominica | 0.0 /100 | #316 | Tragic 6.7% |
| Shoshone | 0.0 /100 | #317 | Tragic 6.8% |
| Immigrants | Cabo Verde | 0.0 /100 | #318 | Tragic 6.8% |
| British West Indians | 0.0 /100 | #319 | Tragic 6.8% |
| Immigrants | St. Vincent and the Grenadines | 0.0 /100 | #320 | Tragic 6.9% |
| Immigrants | Guyana | 0.0 /100 | #321 | Tragic 6.9% |
| Guyanese | 0.0 /100 | #322 | Tragic 6.9% |
| Immigrants | Grenada | 0.0 /100 | #323 | Tragic 6.9% |
| Immigrants | Armenia | 0.0 /100 | #324 | Tragic 7.0% |
| Natives/Alaskans | 0.0 /100 | #325 | Tragic 7.0% |
| Paiute | 0.0 /100 | #326 | Tragic 7.1% |
| Pueblo | 0.0 /100 | #327 | Tragic 7.2% |
| Tsimshian | 0.0 /100 | #328 | Tragic 7.2% |
Demographics Similar to Nicaraguans by Unemployment
In terms of unemployment, the demographic groups most similar to Nicaraguans are Nonimmigrants (5.3%, a difference of 0.050%), Taiwanese (5.3%, a difference of 0.060%), Immigrants from Congo (5.3%, a difference of 0.080%), Afghan (5.3%, a difference of 0.080%), and Malaysian (5.3%, a difference of 0.11%).
| Demographics | Rating | Rank | Unemployment |
| Immigrants | Morocco | 59.1 /100 | #169 | Average 5.2% |
| Immigrants | Nicaragua | 57.1 /100 | #170 | Average 5.2% |
| Puget Sound Salish | 56.6 /100 | #171 | Average 5.2% |
| Immigrants | Vietnam | 52.5 /100 | #172 | Average 5.2% |
| Immigrants | Poland | 51.8 /100 | #173 | Average 5.3% |
| Immigrants | Congo | 50.0 /100 | #174 | Average 5.3% |
| Taiwanese | 49.6 /100 | #175 | Average 5.3% |
| Nicaraguans | 48.7 /100 | #176 | Average 5.3% |
| Immigrants | Nonimmigrants | 47.9 /100 | #177 | Average 5.3% |
| Afghans | 47.4 /100 | #178 | Average 5.3% |
| Malaysians | 46.8 /100 | #179 | Average 5.3% |
| Immigrants | Greece | 45.0 /100 | #180 | Average 5.3% |
| Albanians | 43.5 /100 | #181 | Average 5.3% |
| Spaniards | 42.2 /100 | #182 | Average 5.3% |
| Brazilians | 40.2 /100 | #183 | Average 5.3% |