Immigrants from Ecuador vs Nicaraguan Unemployment
COMPARE
Immigrants from Ecuador
Nicaraguan
Unemployment
Unemployment Comparison
Immigrants from Ecuador
Nicaraguans
6.2%
UNEMPLOYMENT
0.0/ 100
METRIC RATING
293rd/ 347
METRIC RANK
5.3%
UNEMPLOYMENT
48.7/ 100
METRIC RATING
176th/ 347
METRIC RANK
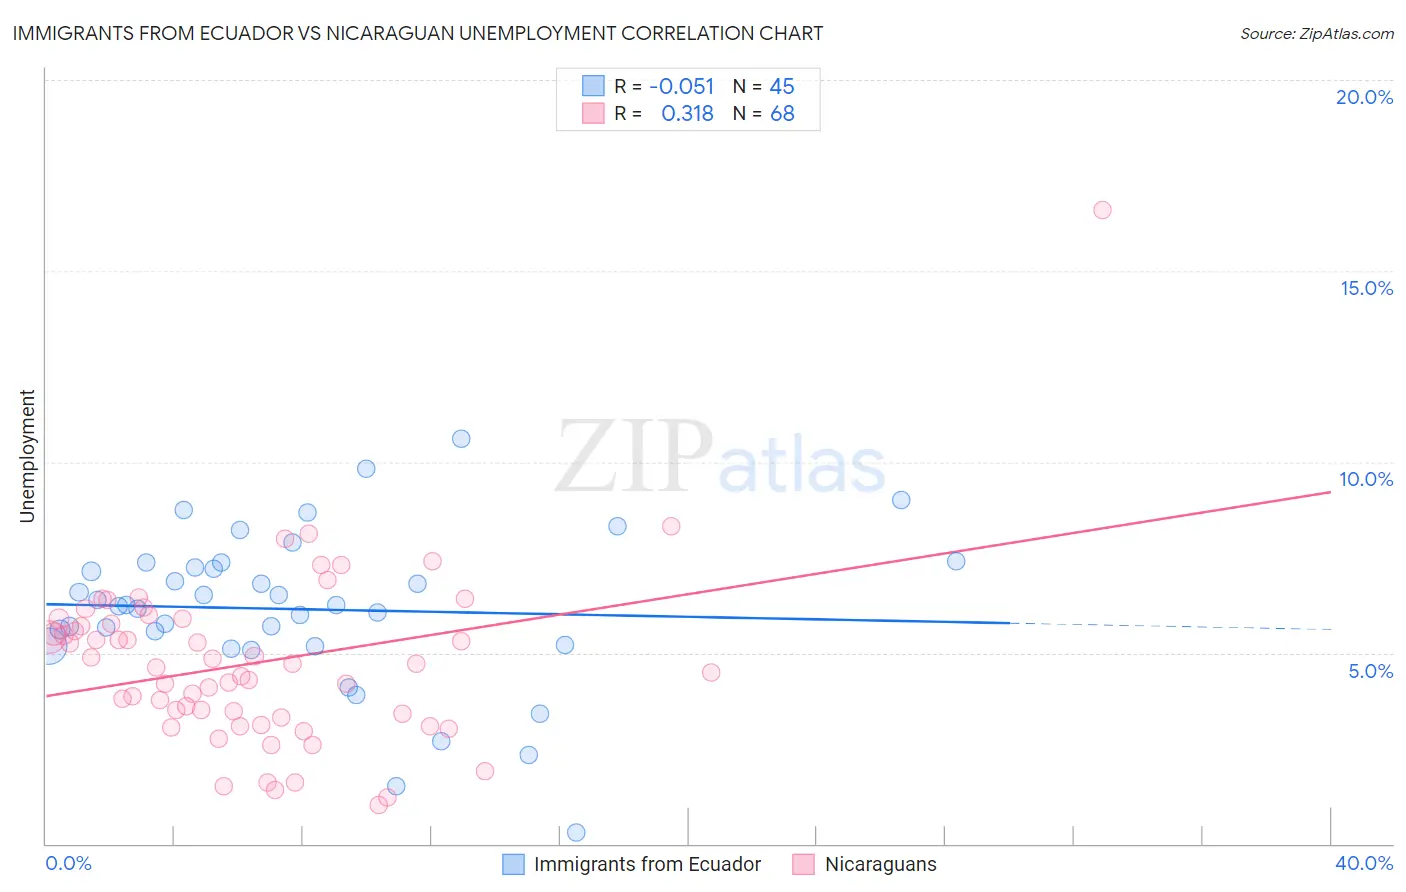
Immigrants from Ecuador vs Nicaraguan Unemployment Correlation Chart
The statistical analysis conducted on geographies consisting of 270,858,036 people shows a slight negative correlation between the proportion of Immigrants from Ecuador and unemployment in the United States with a correlation coefficient (R) of -0.051 and weighted average of 6.2%. Similarly, the statistical analysis conducted on geographies consisting of 285,592,147 people shows a mild positive correlation between the proportion of Nicaraguans and unemployment in the United States with a correlation coefficient (R) of 0.318 and weighted average of 5.3%, a difference of 18.6%.
Unemployment Correlation Summary
| Measurement | Immigrants from Ecuador | Nicaraguan |
| Minimum | 0.30% | 1.0% |
| Maximum | 10.6% | 16.6% |
| Range | 10.3% | 15.6% |
| Mean | 6.1% | 4.7% |
| Median | 6.3% | 4.7% |
| Interquartile 25% (IQ1) | 5.2% | 3.4% |
| Interquartile 75% (IQ3) | 7.3% | 5.8% |
| Interquartile Range (IQR) | 2.1% | 2.5% |
| Standard Deviation (Sample) | 2.0% | 2.3% |
| Standard Deviation (Population) | 2.0% | 2.3% |
Similar Demographics by Unemployment
Demographics Similar to Immigrants from Ecuador by Unemployment
In terms of unemployment, the demographic groups most similar to Immigrants from Ecuador are Spanish American Indian (6.2%, a difference of 0.0%), Central American Indian (6.2%, a difference of 0.090%), Haitian (6.2%, a difference of 0.11%), U.S. Virgin Islander (6.3%, a difference of 0.12%), and Ute (6.3%, a difference of 0.57%).
| Demographics | Rating | Rank | Unemployment |
| Immigrants | Caribbean | 0.0 /100 | #286 | Tragic 6.2% |
| Nepalese | 0.0 /100 | #287 | Tragic 6.2% |
| Ecuadorians | 0.0 /100 | #288 | Tragic 6.2% |
| Chippewa | 0.0 /100 | #289 | Tragic 6.2% |
| Senegalese | 0.0 /100 | #290 | Tragic 6.2% |
| Haitians | 0.0 /100 | #291 | Tragic 6.2% |
| Central American Indians | 0.0 /100 | #292 | Tragic 6.2% |
| Immigrants | Ecuador | 0.0 /100 | #293 | Tragic 6.2% |
| Spanish American Indians | 0.0 /100 | #294 | Tragic 6.2% |
| U.S. Virgin Islanders | 0.0 /100 | #295 | Tragic 6.3% |
| Ute | 0.0 /100 | #296 | Tragic 6.3% |
| Jamaicans | 0.0 /100 | #297 | Tragic 6.3% |
| Immigrants | Haiti | 0.0 /100 | #298 | Tragic 6.3% |
| Immigrants | West Indies | 0.0 /100 | #299 | Tragic 6.3% |
| Immigrants | Trinidad and Tobago | 0.0 /100 | #300 | Tragic 6.3% |
Demographics Similar to Nicaraguans by Unemployment
In terms of unemployment, the demographic groups most similar to Nicaraguans are Nonimmigrants (5.3%, a difference of 0.050%), Taiwanese (5.3%, a difference of 0.060%), Immigrants from Congo (5.3%, a difference of 0.080%), Afghan (5.3%, a difference of 0.080%), and Malaysian (5.3%, a difference of 0.11%).
| Demographics | Rating | Rank | Unemployment |
| Immigrants | Morocco | 59.1 /100 | #169 | Average 5.2% |
| Immigrants | Nicaragua | 57.1 /100 | #170 | Average 5.2% |
| Puget Sound Salish | 56.6 /100 | #171 | Average 5.2% |
| Immigrants | Vietnam | 52.5 /100 | #172 | Average 5.2% |
| Immigrants | Poland | 51.8 /100 | #173 | Average 5.3% |
| Immigrants | Congo | 50.0 /100 | #174 | Average 5.3% |
| Taiwanese | 49.6 /100 | #175 | Average 5.3% |
| Nicaraguans | 48.7 /100 | #176 | Average 5.3% |
| Immigrants | Nonimmigrants | 47.9 /100 | #177 | Average 5.3% |
| Afghans | 47.4 /100 | #178 | Average 5.3% |
| Malaysians | 46.8 /100 | #179 | Average 5.3% |
| Immigrants | Greece | 45.0 /100 | #180 | Average 5.3% |
| Albanians | 43.5 /100 | #181 | Average 5.3% |
| Spaniards | 42.2 /100 | #182 | Average 5.3% |
| Brazilians | 40.2 /100 | #183 | Average 5.3% |