Immigrants from Nigeria vs Nicaraguan In Labor Force | Age 20-64
COMPARE
Immigrants from Nigeria
Nicaraguan
In Labor Force | Age 20-64
In Labor Force | Age 20-64 Comparison
Immigrants from Nigeria
Nicaraguans
79.9%
IN LABOR FORCE | AGE 20-64
86.4/ 100
METRIC RATING
138th/ 347
METRIC RANK
79.3%
IN LABOR FORCE | AGE 20-64
18.3/ 100
METRIC RATING
202nd/ 347
METRIC RANK
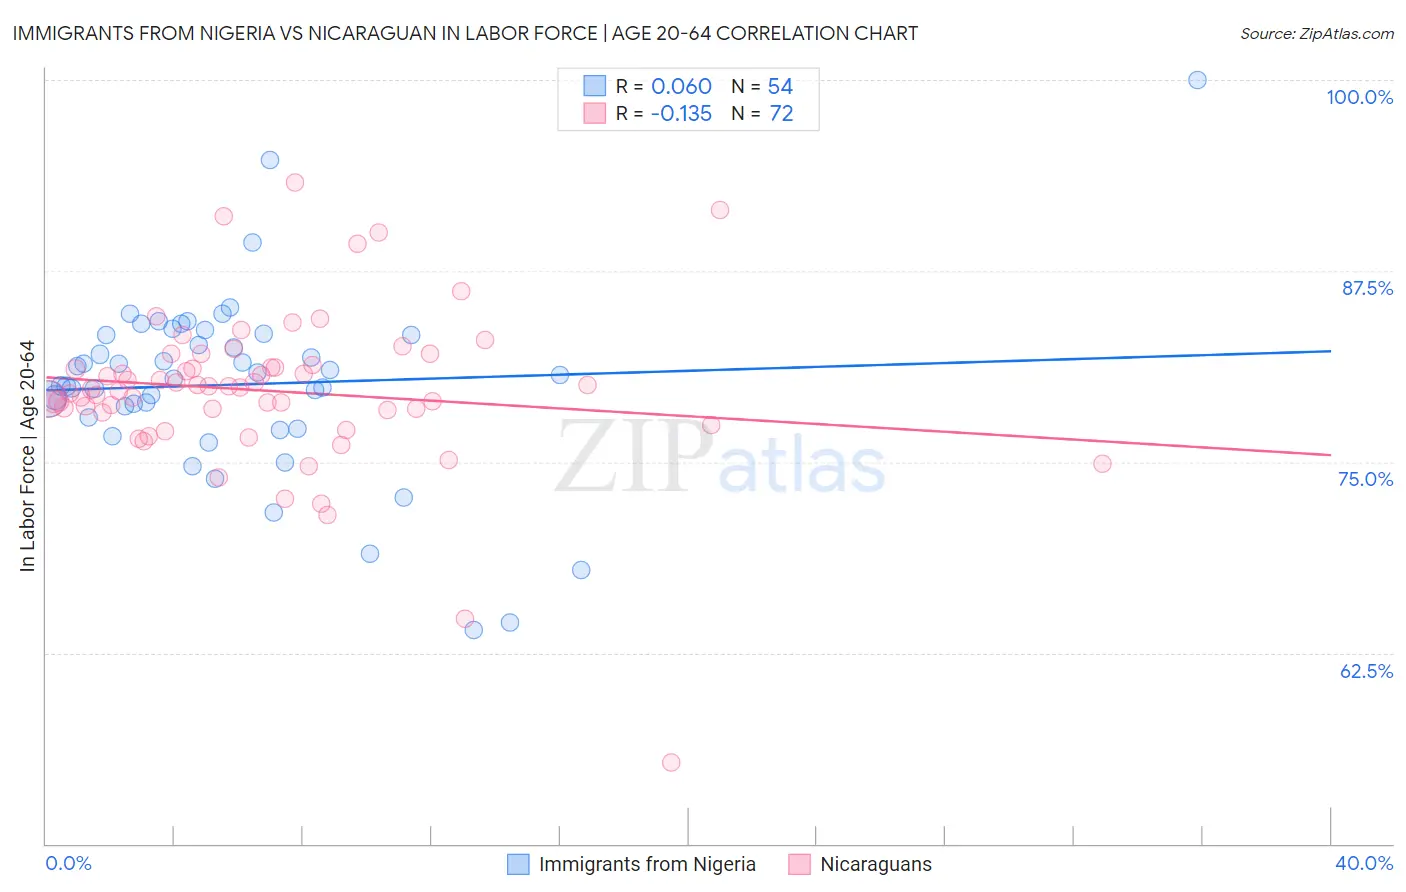
Immigrants from Nigeria vs Nicaraguan In Labor Force | Age 20-64 Correlation Chart
The statistical analysis conducted on geographies consisting of 283,492,708 people shows a slight positive correlation between the proportion of Immigrants from Nigeria and labor force participation rate among population between the ages 20 and 64 in the United States with a correlation coefficient (R) of 0.060 and weighted average of 79.9%. Similarly, the statistical analysis conducted on geographies consisting of 285,718,897 people shows a poor negative correlation between the proportion of Nicaraguans and labor force participation rate among population between the ages 20 and 64 in the United States with a correlation coefficient (R) of -0.135 and weighted average of 79.3%, a difference of 0.67%.
In Labor Force | Age 20-64 Correlation Summary
| Measurement | Immigrants from Nigeria | Nicaraguan |
| Minimum | 64.0% | 55.3% |
| Maximum | 100.0% | 93.3% |
| Range | 36.0% | 38.0% |
| Mean | 80.1% | 79.7% |
| Median | 80.6% | 79.8% |
| Interquartile 25% (IQ1) | 77.9% | 78.3% |
| Interquartile 75% (IQ3) | 83.3% | 81.3% |
| Interquartile Range (IQR) | 5.4% | 3.0% |
| Standard Deviation (Sample) | 6.1% | 5.3% |
| Standard Deviation (Population) | 6.0% | 5.3% |
Similar Demographics by In Labor Force | Age 20-64
Demographics Similar to Immigrants from Nigeria by In Labor Force | Age 20-64
In terms of in labor force | age 20-64, the demographic groups most similar to Immigrants from Nigeria are Immigrants from Ukraine (79.9%, a difference of 0.0%), Ukrainian (79.9%, a difference of 0.010%), Immigrants from Singapore (79.9%, a difference of 0.010%), Indian (Asian) (79.9%, a difference of 0.020%), and South American Indian (79.9%, a difference of 0.020%).
| Demographics | Rating | Rank | In Labor Force | Age 20-64 |
| Immigrants | Iran | 88.3 /100 | #131 | Excellent 79.9% |
| Indians (Asian) | 87.7 /100 | #132 | Excellent 79.9% |
| South American Indians | 87.6 /100 | #133 | Excellent 79.9% |
| Belgians | 87.4 /100 | #134 | Excellent 79.9% |
| Ukrainians | 86.8 /100 | #135 | Excellent 79.9% |
| Immigrants | Singapore | 86.7 /100 | #136 | Excellent 79.9% |
| Immigrants | Ukraine | 86.5 /100 | #137 | Excellent 79.9% |
| Immigrants | Nigeria | 86.4 /100 | #138 | Excellent 79.9% |
| Immigrants | Spain | 83.9 /100 | #139 | Excellent 79.8% |
| Immigrants | South Eastern Asia | 80.4 /100 | #140 | Excellent 79.8% |
| Immigrants | Israel | 80.0 /100 | #141 | Good 79.8% |
| Slovaks | 79.9 /100 | #142 | Good 79.8% |
| Immigrants | Sweden | 79.7 /100 | #143 | Good 79.8% |
| Koreans | 79.6 /100 | #144 | Good 79.8% |
| Pakistanis | 79.3 /100 | #145 | Good 79.8% |
Demographics Similar to Nicaraguans by In Labor Force | Age 20-64
In terms of in labor force | age 20-64, the demographic groups most similar to Nicaraguans are Immigrants from Oceania (79.3%, a difference of 0.010%), Immigrants from Nicaragua (79.3%, a difference of 0.010%), Iraqi (79.3%, a difference of 0.010%), Immigrants from Cambodia (79.3%, a difference of 0.010%), and Immigrants from Congo (79.3%, a difference of 0.010%).
| Demographics | Rating | Rank | In Labor Force | Age 20-64 |
| Immigrants | Austria | 23.7 /100 | #195 | Fair 79.4% |
| Ecuadorians | 23.1 /100 | #196 | Fair 79.4% |
| Immigrants | Senegal | 22.5 /100 | #197 | Fair 79.4% |
| Immigrants | Laos | 21.5 /100 | #198 | Fair 79.4% |
| Dutch | 20.2 /100 | #199 | Fair 79.3% |
| Immigrants | Oceania | 19.1 /100 | #200 | Poor 79.3% |
| Immigrants | Nicaragua | 19.0 /100 | #201 | Poor 79.3% |
| Nicaraguans | 18.3 /100 | #202 | Poor 79.3% |
| Iraqis | 17.7 /100 | #203 | Poor 79.3% |
| Immigrants | Cambodia | 17.6 /100 | #204 | Poor 79.3% |
| Immigrants | Congo | 17.5 /100 | #205 | Poor 79.3% |
| Immigrants | Ecuador | 16.9 /100 | #206 | Poor 79.3% |
| Sub-Saharan Africans | 16.5 /100 | #207 | Poor 79.3% |
| British | 16.5 /100 | #208 | Poor 79.3% |
| Bangladeshis | 16.4 /100 | #209 | Poor 79.3% |