Immigrants from Nigeria vs Immigrants from Netherlands Unemployment
COMPARE
Immigrants from Nigeria
Immigrants from Netherlands
Unemployment
Unemployment Comparison
Immigrants from Nigeria
Immigrants from Netherlands
5.8%
UNEMPLOYMENT
0.1/ 100
METRIC RATING
267th/ 347
METRIC RANK
4.9%
UNEMPLOYMENT
99.0/ 100
METRIC RATING
60th/ 347
METRIC RANK
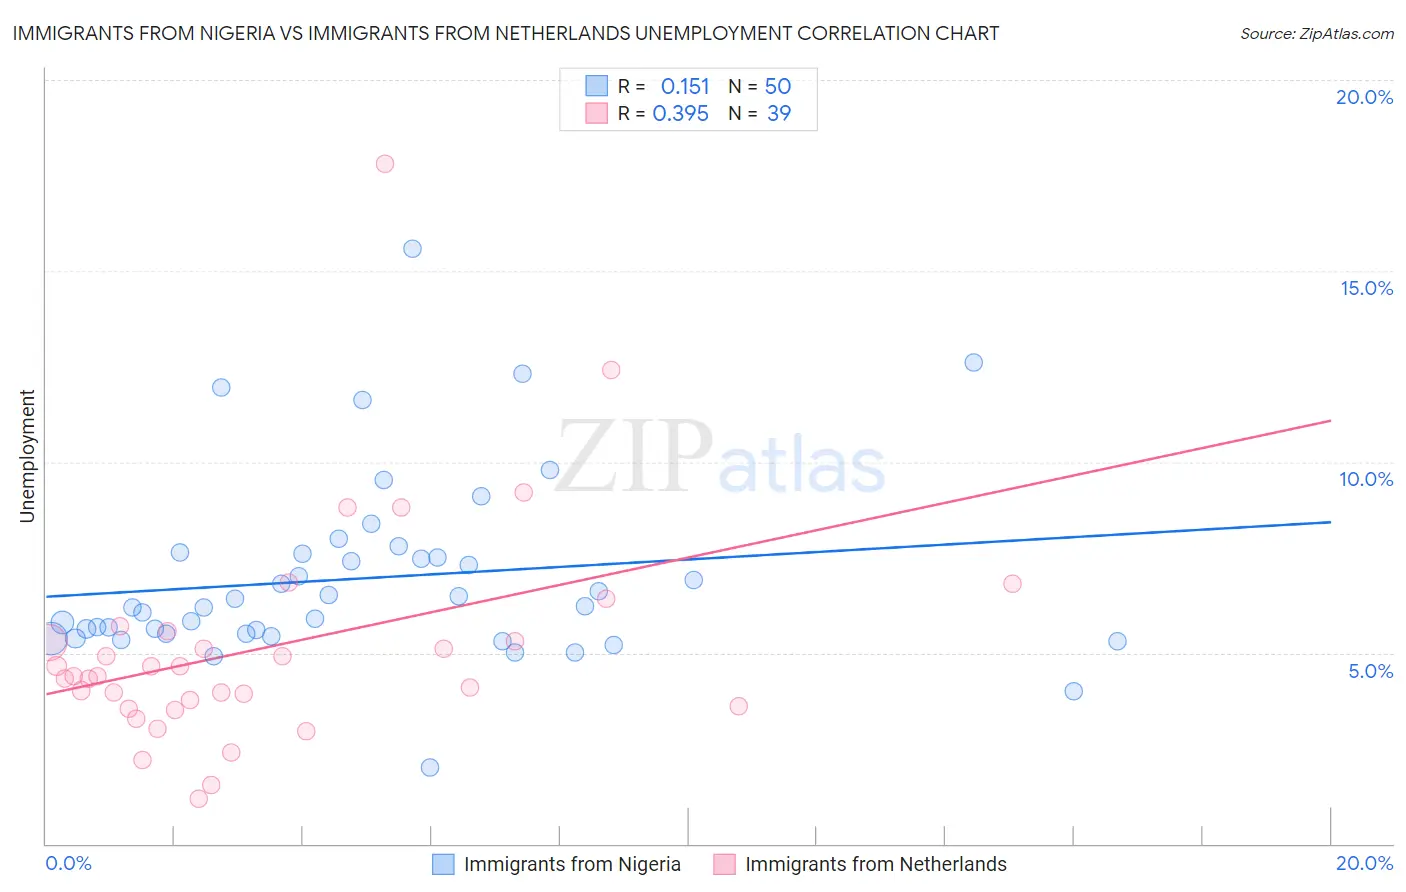
Immigrants from Nigeria vs Immigrants from Netherlands Unemployment Correlation Chart
The statistical analysis conducted on geographies consisting of 283,412,431 people shows a poor positive correlation between the proportion of Immigrants from Nigeria and unemployment in the United States with a correlation coefficient (R) of 0.151 and weighted average of 5.8%. Similarly, the statistical analysis conducted on geographies consisting of 237,753,486 people shows a mild positive correlation between the proportion of Immigrants from Netherlands and unemployment in the United States with a correlation coefficient (R) of 0.395 and weighted average of 4.9%, a difference of 19.4%.
Unemployment Correlation Summary
| Measurement | Immigrants from Nigeria | Immigrants from Netherlands |
| Minimum | 2.0% | 1.2% |
| Maximum | 15.6% | 17.8% |
| Range | 13.6% | 16.6% |
| Mean | 7.0% | 5.2% |
| Median | 6.2% | 4.4% |
| Interquartile 25% (IQ1) | 5.5% | 3.6% |
| Interquartile 75% (IQ3) | 7.6% | 5.6% |
| Interquartile Range (IQR) | 2.1% | 2.0% |
| Standard Deviation (Sample) | 2.4% | 3.0% |
| Standard Deviation (Population) | 2.4% | 3.0% |
Similar Demographics by Unemployment
Demographics Similar to Immigrants from Nigeria by Unemployment
In terms of unemployment, the demographic groups most similar to Immigrants from Nigeria are Immigrants from Sierra Leone (5.8%, a difference of 0.040%), Immigrants from El Salvador (5.8%, a difference of 0.050%), Mexican American Indian (5.8%, a difference of 0.070%), Blackfeet (5.8%, a difference of 0.13%), and Mexican (5.9%, a difference of 0.36%).
| Demographics | Rating | Rank | Unemployment |
| Immigrants | Uzbekistan | 0.1 /100 | #260 | Tragic 5.8% |
| Immigrants | Guatemala | 0.1 /100 | #261 | Tragic 5.8% |
| Sierra Leoneans | 0.1 /100 | #262 | Tragic 5.8% |
| Salvadorans | 0.1 /100 | #263 | Tragic 5.8% |
| Immigrants | Liberia | 0.1 /100 | #264 | Tragic 5.8% |
| Nigerians | 0.1 /100 | #265 | Tragic 5.8% |
| Mexican American Indians | 0.1 /100 | #266 | Tragic 5.8% |
| Immigrants | Nigeria | 0.1 /100 | #267 | Tragic 5.8% |
| Immigrants | Sierra Leone | 0.1 /100 | #268 | Tragic 5.8% |
| Immigrants | El Salvador | 0.1 /100 | #269 | Tragic 5.8% |
| Blackfeet | 0.1 /100 | #270 | Tragic 5.8% |
| Mexicans | 0.1 /100 | #271 | Tragic 5.9% |
| Hispanics or Latinos | 0.0 /100 | #272 | Tragic 5.9% |
| Immigrants | Fiji | 0.0 /100 | #273 | Tragic 5.9% |
| Bahamians | 0.0 /100 | #274 | Tragic 5.9% |
Demographics Similar to Immigrants from Netherlands by Unemployment
In terms of unemployment, the demographic groups most similar to Immigrants from Netherlands are Cambodian (4.9%, a difference of 0.0%), Icelander (4.9%, a difference of 0.010%), Immigrants from Bulgaria (4.9%, a difference of 0.030%), Bhutanese (4.9%, a difference of 0.050%), and Greek (4.9%, a difference of 0.070%).
| Demographics | Rating | Rank | Unemployment |
| Immigrants | Zimbabwe | 99.2 /100 | #53 | Exceptional 4.9% |
| Eastern Europeans | 99.2 /100 | #54 | Exceptional 4.9% |
| Australians | 99.2 /100 | #55 | Exceptional 4.9% |
| Celtics | 99.1 /100 | #56 | Exceptional 4.9% |
| Immigrants | Singapore | 99.1 /100 | #57 | Exceptional 4.9% |
| Greeks | 99.0 /100 | #58 | Exceptional 4.9% |
| Bhutanese | 99.0 /100 | #59 | Exceptional 4.9% |
| Immigrants | Netherlands | 99.0 /100 | #60 | Exceptional 4.9% |
| Cambodians | 99.0 /100 | #61 | Exceptional 4.9% |
| Icelanders | 98.9 /100 | #62 | Exceptional 4.9% |
| Immigrants | Bulgaria | 98.9 /100 | #63 | Exceptional 4.9% |
| Italians | 98.9 /100 | #64 | Exceptional 4.9% |
| Immigrants | Canada | 98.8 /100 | #65 | Exceptional 4.9% |
| Slovaks | 98.7 /100 | #66 | Exceptional 4.9% |
| New Zealanders | 98.6 /100 | #67 | Exceptional 4.9% |